
Figure 5.
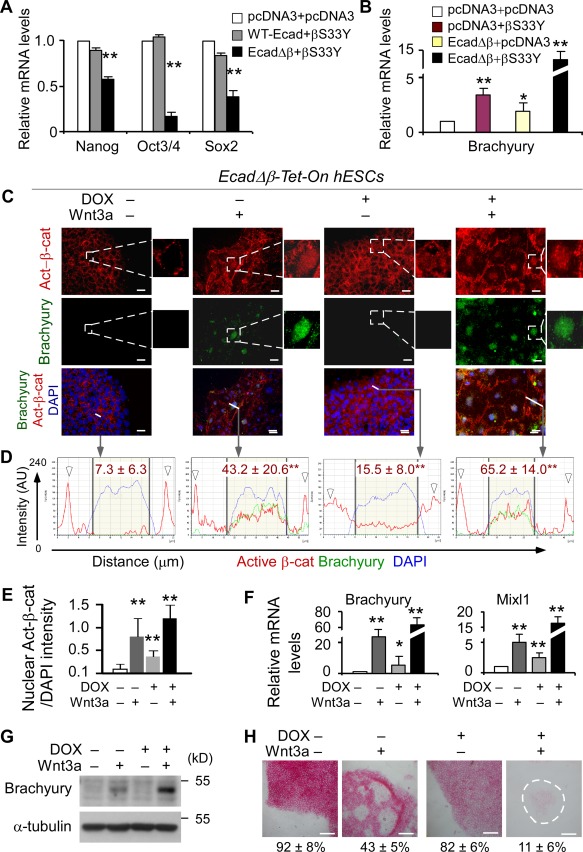
E‐cadherin sequesters β‐catenin to suppress Wnt‐induced hESC differentiation. (A): Q‐PCR analysis of hESCs cotransfected with βS33Y plasmids and either wild‐type E‐cadherin (WT‐Ecad) or EcadΔβ for 24 hours. pcDNA: control vector. (B): In comparison to control groups, co‐overexpression of EcadΔβ and βS33Y for 24 hours significantly increases Brachyury expression (Q‐PCR). (C): EcadΔβ‐Tet‐On hESCs were treated with or without doxycycline (DOX+, 2 µg/ml) or vehicle in the presence or absence of Wnt3a protein (100 ng/ml) for 4–6 days and analyzed by double‐immunostaining. Nuclei were counterstained with DAPI (blue). Scale bar = 20 µm. (D): Subcellular localization analysis of the expression of active β‐catenin and Brachyury as shown in (C). Plots of the intensity profile of active β‐catenin (red), Brachyury (green), and DAPI (blue) over a linear section of a whole cell (white lines in C) are representative of >100 cells/group analyzed. Data are expressed as AU versus length in microns. The arrowheads indicate the cell‐cell contact areas; the yellow area in the middle of each plot marks the nuclear region; mean ± SD in red on each plot represent the mean pixel intensity of the nuclear active β‐catenin from >100 cells/group. (E): Quantification of the ratio of active β‐catenin nuclear staining/DAPI intensity for the indicated groups in (C). Data are mean ± SD, four replicates from H9 line, **, p < .01 compared to DOX−Wnt3a− group. (F, G): Doxycycline‐induced EcadΔβ over‐expression promotes hESC differentiation in response to Wnt3a treatment as revealed by significant upregulation of Brachyury and Mixl1 (F, Q‐PCR; G, Western blot). (H): Alkaline phosphatase (AP) staining and quantitative analyses. At day 4 of treatments as indicated, cells were dissociated and reseeded. AP‐positive colonies were counted when >50% of the cells within the colony were positive for AP staining. The percentages of AP+ colonies were quantitatively assessed and are shown at the bottom. The dashed line indicates the boundary of the colony. Scale bar = 100 µm. The results represent three replicates ± SD from H1 and H9 lines. *, p <.05; **, p <.01. Abbreviations: AU, arbitrary unit; hESC, human embryonic stem cell.