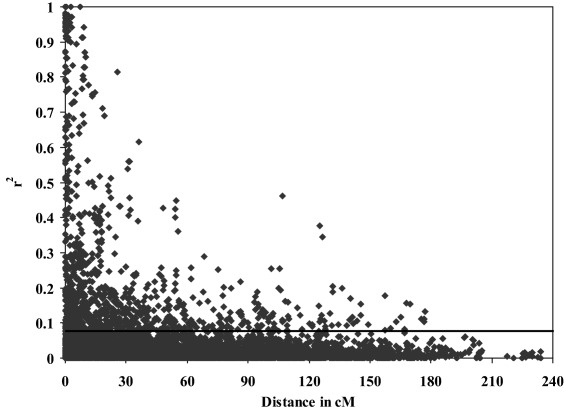
Figure 1.

Linkage disequilibrium (r 2) as a function of map distance for 455 markers, including 340 Diversity Array Technology (DArT) markers and 115 simple‐sequence repeat (SSR) markers, among 225 wheat cultivars. The horizontal line indicates the 95th percentile of the distribution of r 2 between unlinked markers (r 2 = 0.0774).
