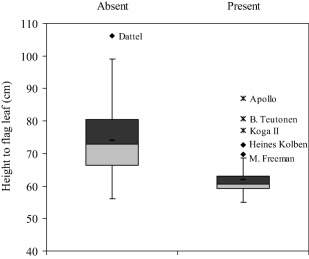
Figure 2.

Box‐plots comparing height to flag leaf (HtFL) between lines with or without Diversity Array Technology (DArT) marker wPt‐0472, closely linked to Rht‐D1b. Box, interquartile range; horizontal line, median; whiskers, 1.5× interquartile range; filled diamonds, outliers; stars, extreme values >3× interquartile range.
