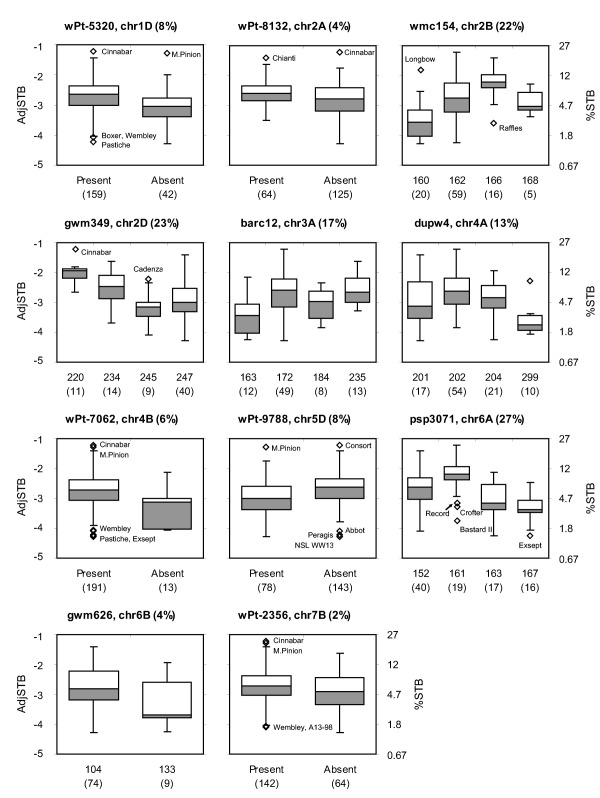
Figure 3.

Effects of markers significantly associated with Septoria. AdjSTB data are residuals of logit(Septoria) regressed on height to flag leaf (HtFL); the equivalent percentage leaf area diseased (%STB) is on the secondary axis. Presentation of box‐plots as in Fig. 2. Percentage variation in AdjSTB explained by a general linear model with each marker as the sole explanatory variable is given after the chromosome location. Alleles are fragment sizes (bp) for simple‐sequence repeat (SSR) markers or presence and absence of Diversity Array Technology (DArT) markers, with the number of lines with that allele. Alleles found in fewer than five lines are omitted.
