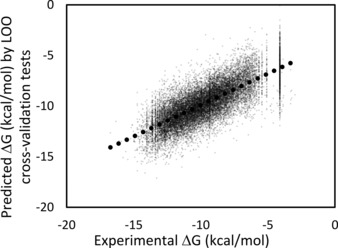
Figure 3.

Correlation between the experimental and prediction data for all 97 kinase proteins obtained by the weighted PCR model with x=0.1 and the number of replicas=1. Black dots represent the least‐squares fitting line, and the correlation coefficient is 0.76. The dotted line represents the fitted result.
