
Figure 4.
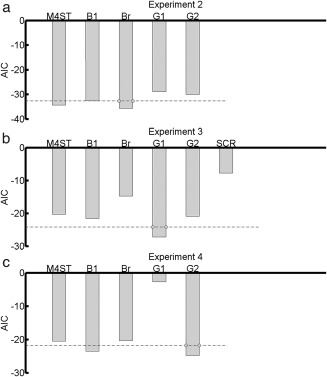
Comparison of M4ST with other methods for trial‐by‐trial normalized response measures. The graph shows predictive validity, quantified as Akaike information criterion (AIC, smaller is better) for model M4ST, four peak‐scoring methods (B1, Br, G1, G2), and SCR. Dashed lines represent the decision thresholds with respect to the best model (absolute AIC difference > 3). a: Experiment 2. b: Experiment 3. c: Experiment 4.