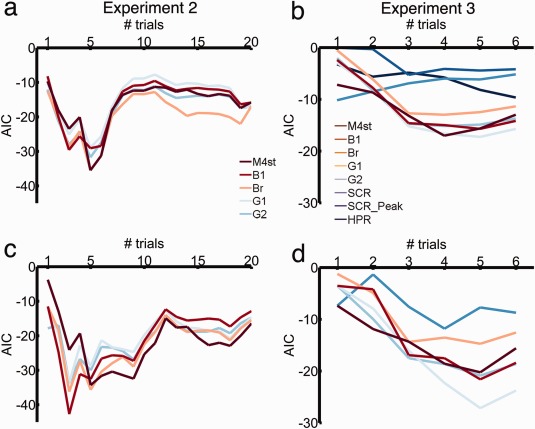
Figure 5.

Comparison of different number of trials included in analysis, for model M4ST, four peak‐scoring methods (B1, Br, G1, G2), SCR (model‐based analysis), peak‐scored SCR (SCR_Peak), and HPR. The graph shows predictive validity, quantified as Akaike information criterion (AIC, smaller is better). a: Experiment 2, nonnormalized response measures. b: Experiment 2, nonnormalized response measures. c: Experiment 2, normalized response measures. d: Experiment 3, normalized response measures.
