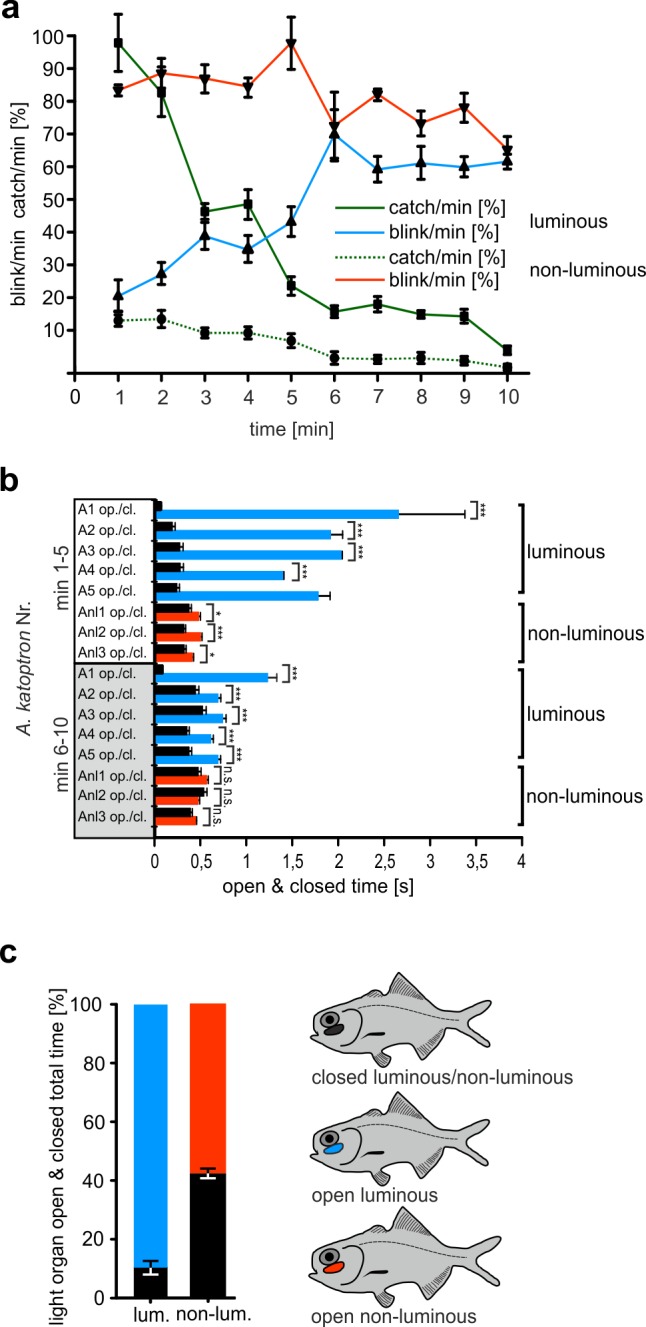
Fig 4. Blink frequency and catch efficiency in A. katoptron feeding on currently hatching cleaner shrimp larvea (L. amboiensis).

(a) Blink frequency percentiles for specimens with luminous (blue line A1-A5, n = 5) and non-luminous (red line Anl1-Anl3, n = 3) light organs during 2 subsequent 5 minute recording sessions (minute 1–5 & minute 6–10) to illustrate the changes during decreasing larvae density. (b) Average open & closed time of light organs for individual specimens with luminous light organs (A1-A5, n = 5) and non-luminous light organs (Anl1-Anl3, n = 3). Pooled data from two subsequent observation periods, (min 1–5: directly after hatching; min 6–10: observation period directly after min 1–5) each of five minutes. (c) Percentile distribution of open & closed times of light organs in A. katoptron, summary of the 10 min feeding period. Icons illustrate color coding for bar graphs 4b and 4c. Icons illustrate color coding in c. Black indicates closed light organs for both luminous and non-luminous light organs. Blue indicates luminous open light organs. Red indicates non-luminous open light organs. Error bars indicate ± SEM.
