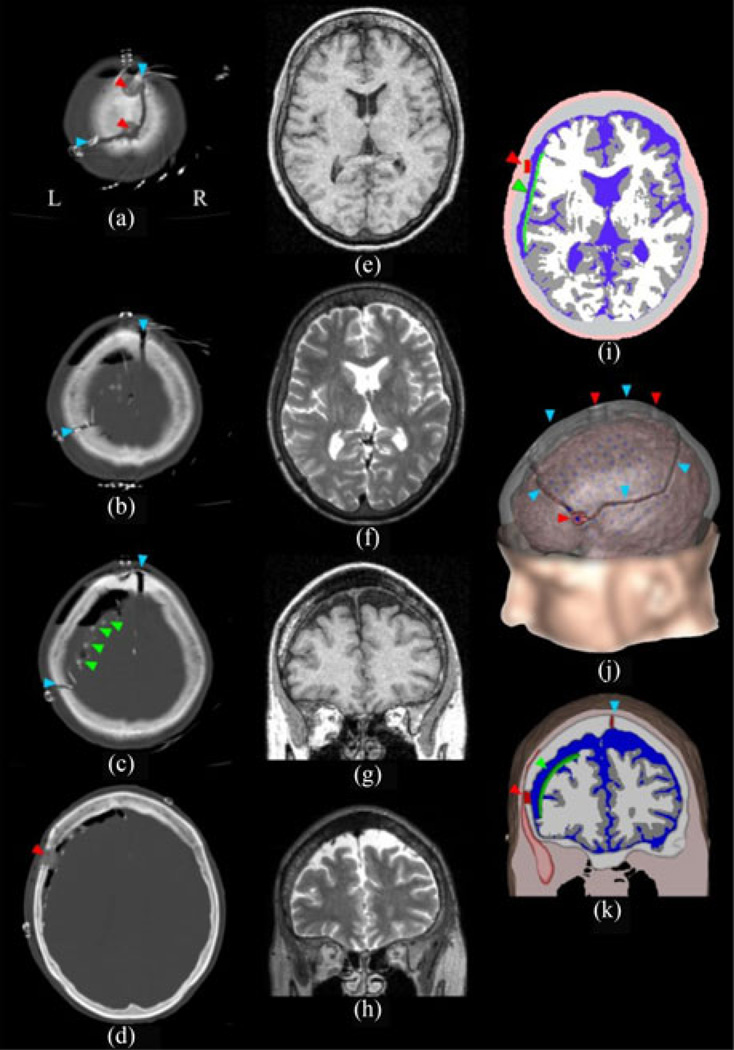
Fig. 1.
CT and MRI imaging data and volume conductor head model. (a)–(d) Axial CT images taken after subdural electrode implantation. (e) and (f) Axial slices through preoperative T1 and T2 weighted MRI data, respectively. (g) and (h) Coronal slices through preoperative T1 and T2 weighted MRI data, respectively. (i) Axial slice through segmented data of Head Model 1 (HM 1, with craniotomy defects and with grid, see Section II). For comparison with the MRI data the slice was taken at the same position as in (e) and (f). Soft tissue: light pink; air: black; temporalis muscle: dark pink; skull: light gray; craniotomy defects: red; ECoG grid: green; CSF: blue; gray matter: dark gray; and white matter: light gray. (j) 3-D visualization of HM 1. Gray matter surface: pink; electrodes: blue; skull: transparent gray. (k) 3-D coronal slice through volume conductor model (HM1). For comparison with the MRI data, the slice was taken at the same position as in (g) and (h). Conventions as in (i). The red, turquoise, and green arrowheads indicate the burr holes, saw lines, and the electrode grid, respectively.

