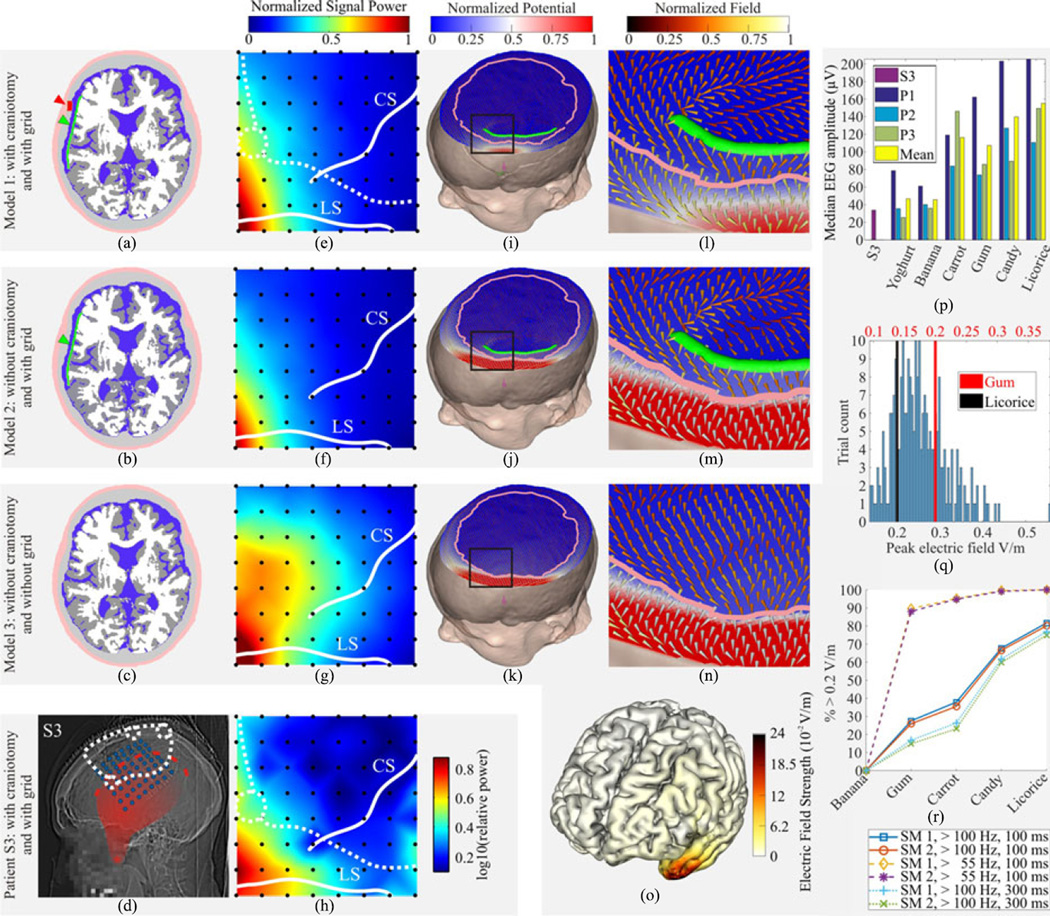
Fig. 3.
FEM simulation compared to intracranial recordings. (a)–(c) Axial slices through all three head models. Craniotomy (red) and silicone grid (green) indicated by red and green arrows, respectively. Soft tissue: light pink; skull: light gray; CSF: blue; gray matter: dark gray; and white matter: light gray. (d) Lateral X-ray with superimposed positions of implanted electrodes (blue), burr holes (white dashed discs), saw lines (white dashed lines), and the temporal muscle (red) with the temporal line (red dashed line) as its origin, and the coronoid process of the mandibular bone (red asterisk) as its insertion, the variation in transparency reflects the thickness of the temporal muscle that increases toward the coronoid process. (e)–(g) Interpolated EMG power caused by SM 2 reproducing the power maxima in the anterio-inferior corner of the grid as observed in the recorded ECoG data (h). Electrode positions are marked with black disks. The saw lines and burr holes are indicated by white dashed lines and discs, and the lateral (LS) and central sulci (CS) are indicated by continuous white lines. (h) Intracranial topography of ChRE in the gamma frequency range (32–400 Hz). Conventions as in (e)–(g). (i)–(k) Skin: beige, skull: dark gray; dipole: magenta; ECoG grid: green. Outline of inner skull surface is marked by pink line (interrupted at the positions of the saw lines in HM 1). (l)–(n) Magnifications of the regions indicated by black boxes in (i)–(k) showing both the normalized potential (the background colors using a blue–white–red color scale) and the normalized EF (foreground cones using a red–yellow–white color scale) around the edge of the silicone grid. (o) Cortical EF (median across trials) expected in healthy individuals during chewing of licorice using SM 1. Maximal EF strength was found in the temporal pole and anterior medial and lateral temporal cortex. (p) ChR median EEG amplitudes of patient S3 and, for each chewing condition, of participants P1–3. (q) Distribution of the peak cortical EF strength across trials expected in healthy individuals for gum chewing (red units) and licorice (black units) chewing. All trials to the right of the red and black bars exceeded 0.2 V/m. Previous studies suggest modulatory effects on ongoing brain activity above this threshold (see Section IV). (r) Percentage of trials producing peak cortical EF exceeding 0.2 V/m for each chewing condition (yoghurt not shown as the percentage was always 0%), Source Models (SM) 1 and 2 (SM 3 not shown as always 100%) and different analysis parameters for high-pass frequency and amplitude window.

