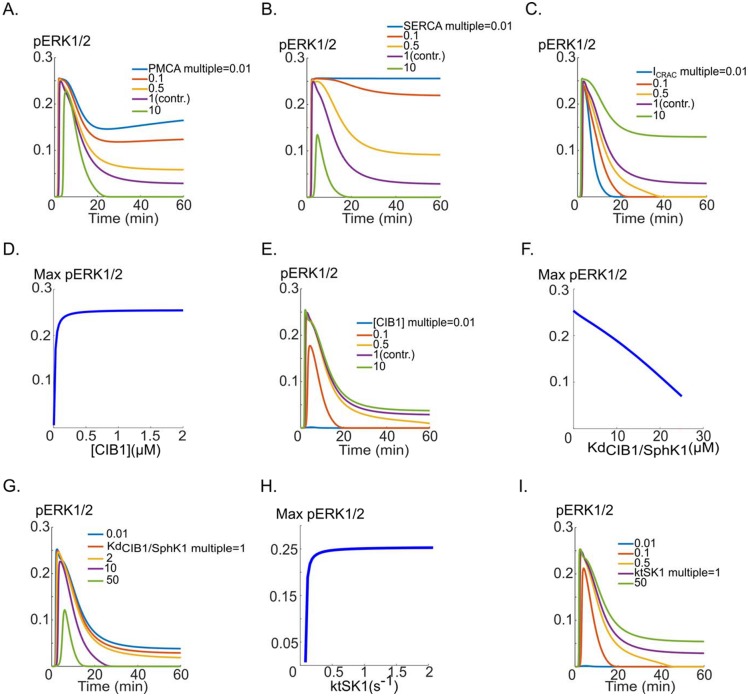
Fig 4. The effects of perturbations in calcium cycling on pERK1/2 dynamics.
A. PMCA inhibition results in sustained pERK1/2 curve (blue), while the maximum value of pERK1/2 is unchanged. The plateau phase of pERK1/2 is progressively prolonged as the pump rate is reduced from the base value (pink, multiple of one), B. pERK1/2 versus time curves for five different values of the SERCA pump rate. C. The effect of varying CRAC channel current amplitude on the shape of the pERK1/2 versus time curve, illustrating the prolongation of the pERK1/2 signal, D. The changes in maximum pERK1/2 as a function of variations in total concentration of CIB1. There is rapid decline of pERK1/2 signal for CIB1 concentrations below ~80 nM. E. pERK1/2 versus time in response to CIB1 concentration, F. The dissociation constant for the binding of Ca2+/CIB1 to SphK1 starkly influences the maximum value of pERK1/2, G. pERK1/2 for different values of the dissociation constant, H. The maximum pERK1/2 as a function of the translocation rate of CIB1/SphK1 to the membrane (ktSK1), I. pERK1/2 versus time in response to changes in ktSK1.

