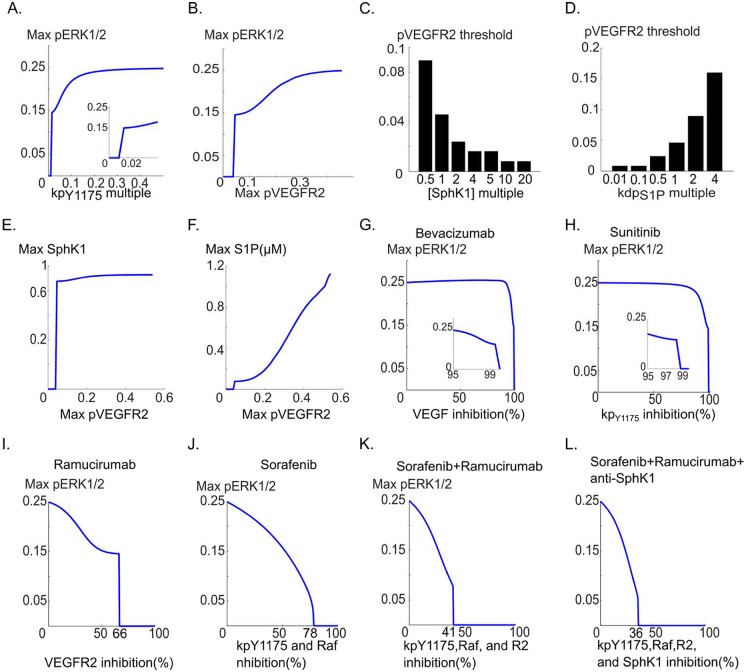
Fig 5. Relation between pERK1/2 and pVEGFR2 and its modulation by SphK1 pathway.
A. pERK1/2 versus the phosphorylation rate of the receptor, B. Maximum pERK1/2 versus pVEGFR2 demonstrates the existence of a threshold value of pVEGFR2 below which there is no ERK1/2 activation. The critical value is 0.046, C. pVEGFR2 threshold is decreased in response to increases in SphK1 concentration. Increasing SphK1 to 1 μM from the baseline value of 0.1 μM reduces the threshold from 0.046 to 0.008, D. pVEGFR2 threshold value is sharply increased by increasing S1P dephosphorylation rate, from 0.008 to 0.16, E. Maximum active SphK1 versus max pVEGFR2 curve with similar threshold behavior, F. Maximum S1P shows monotonically increasing behavior relative to pVEGFR2 for pVEGFR2 values above the threshold value of 0.046, G. Maximum pERK1/2 versus percent inhibition of VEGF. The inset shows the threshold region: 99% sequestration of VEGF is necessary before ERK1/2 activation is blocked, H. Maximum pERK1/2 versus percent inhibition of the receptor phosphorylation. Inset shows the threshold region, I. Simulating the effect of VEGFR2 depletion with a mAb VEGFR2 inhibitor (e.g., ramucirumab) on pERK1/2, J. Simulating the effect of a generic multi-target tyrosine kinase inhibitor (e.g., sorafenib) on pERK1/2 simultaneously blocking VEGFR2 phosphorylation and Raf activation, K. Combined effect of sorafenib and ramucirumab demonstrating enhanced ERK1/2 inhibition, L. Combined effect of sorafenib, ramucirumab, and SphK1 inhibition on pERK1/2.

