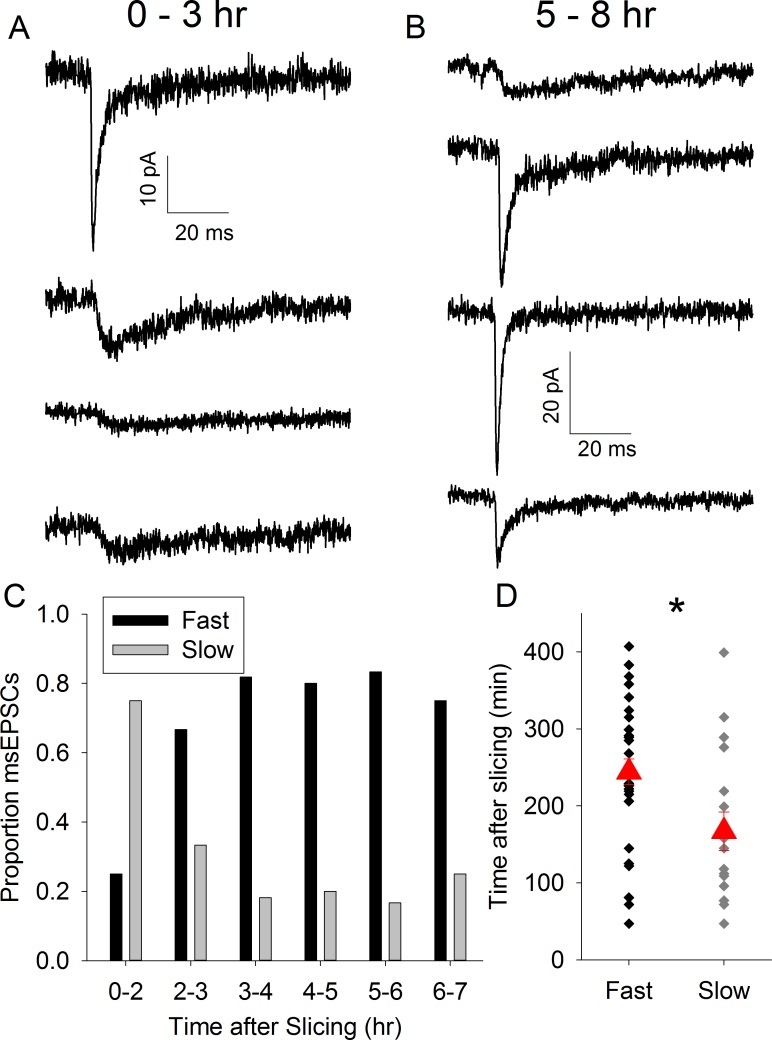
Fig 2. Proportion of msEPSCs Displaying Slow-Only Kinetics Decrease with Time In Vitro.
A. Average msEPSC traces from representative recordings 0–3 hr after slice preparation. B. Average msEPSC traces from representative recordings 5–8 hr after slice preparation. C. Bar chart showing proportion of of msEPSCs displaying fast/mixed (black) or slow (grey) kinetics in time bins indicated. D. Scatter plot showing time of recording of individual fast/mixed and slow msEPSCs after slice preparation in CD1 mice. Red triangles represent mean ± standard error of the mean (s.e.m.) time of all recordings in group. * represents p = <0.05.

