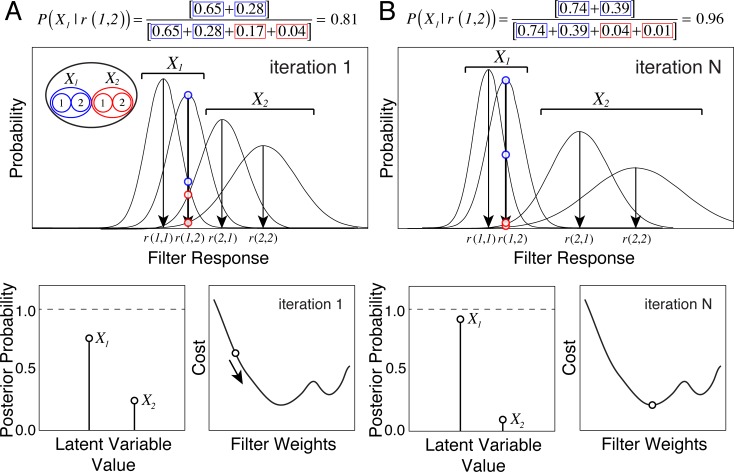
Fig 4. Schematic showing the evolution of hypothetical filter response distributions, posterior probability distributions, and cost with one filter, two latent variable levels, and two stimuli per level.
A Response distributions, posterior, and cost for intermediate filters. B Response distributions, posterior, and cost for optimal filters. Three effects are worth noting. First, as the filters evolve, response distributions to stimuli sharing the same latent variable value become more similar, and response distributions to stimuli having different latent variable values become more different. Second, as the filters improve, more posterior probability mass is concentrated at the correct latent variable value, and cost decreases commensurately. Third, the cost landscape is non-convex.

