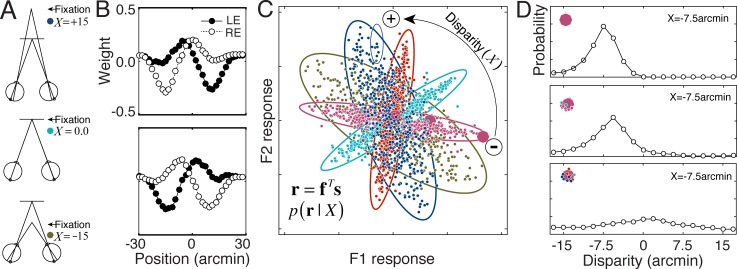
Fig 6. AMA results for disparity estimation with natural stereo images.
A Stereo-geometry for three different disparities: uncrossed disparity (δ = -15 arcmin, eyes fixated in front of target; brown), zero disparity (δ = 0.0 arcmin, eyes fixated on target; turquoise), crossed disparity (δ = +15 arcmin, eyes fixated behind target; blue). B Optimal AMA filters. C Conditional response distributions p(r|x) for five different values of the disparity (i.e. latent variable): -15.0, -7.5, 0.0, +7.5, +15.0 arcmin. Each dot represents the expected joint response to an individual stereo image. The responses are the projection of the stimuli basis elements defined by the filters. The conditional response distributions are well characterized by Gaussians (large colored ellipses). For reference, a small ellipse representing filter response noise associated with one stimulus is shown (upper middle part of plot). D Posterior probability distributions for three stimuli having -7.5 arcmin of disparity (oversized response dots in C). The posteriors decrease in peakiness and increase in bias as the responses approach the origin, reflecting the fact that responses nearer the origin are more difficult to decode.

