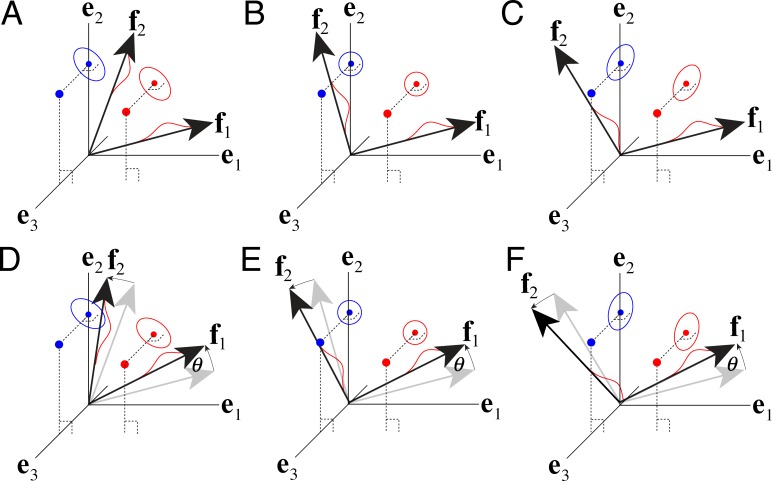
Fig 13. Stimulus encoding fidelity and uniqueness with constant additive noise.
The original stimuli are represented as points in a three dimensional space (bigger red and blue dots, one stimulus from each of two levels of the latent variable). The original stimuli are then projected into a standard (i.e. orthogonal) basis {e1,e2} that spans the same subspace as two (possibly non-orthogonal) filters {f1,f2}. This subspace lies in the e1,e2 plane. The ellipse represents uncertainty about each encoded stimulus. The size and orientation of each uncertainty ellipse is determined by the stimulus (red dot), each filter’s response noise, and correlation between the filters. Red Gaussian bumps represent the noisy response distributions of F1 and F2 to the red stimulus. A Positively correlated () filters. B Orthogonal (i.e. uncorrelated; ) filters. C Negatively correlated () filters. D-F Rotated versions of A-C. Orthogonal filters (B,E) provide rotation invariant encoding; non-orthogonal (i.e. positively and negatively correlated) filters do not (A,C,D,F).

