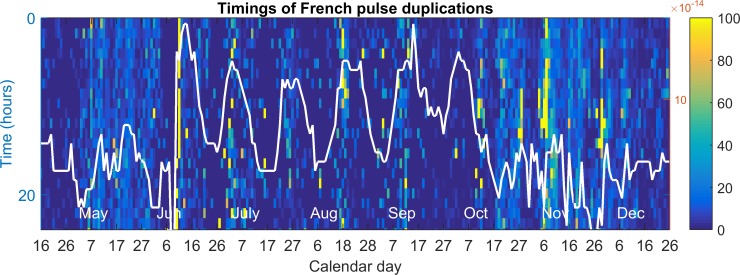
Fig 9. Time course of the percentage of duplicated pulse detections on both channels.
Dark blue is 0% duplications; yellow is 100% duplications. The modal daily accelerometer signal amplitude distribution is superimposed over the top, with a white line and acceleration given on the right hand side in mm/s2.

