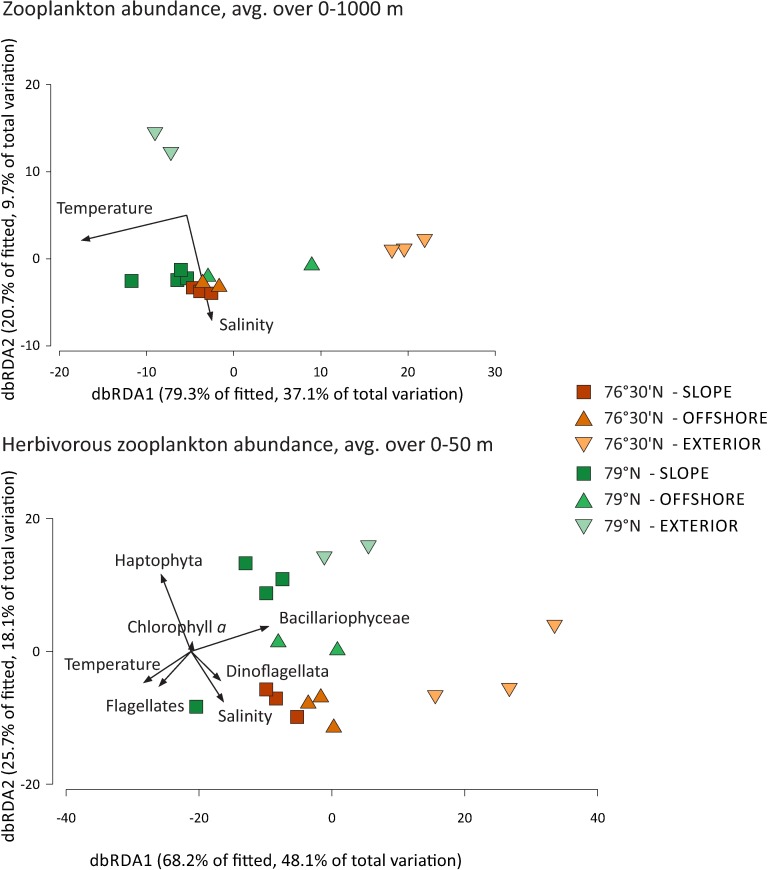
Fig 8. Distance-based redundancy (dbRDA) plots illustrating DistLM models of faunistic similarities among zooplankton and the relationship of zooplankton to hydrographic variables.
The DistLM models presented are: layers integrated for 0–1000 m depth (upper) and layers integrated for 0–50 m depth (down). Model 0–1000 m depth was calculated for similarities among all zooplankton species/taxa; model 0–50 m depth was calculated for herbivorous species/taxa. Zooplankton abundance was square-root transformed; resemblance was estimated based on the Bray-Curtis similarity index. The axis legends include % of variation explained by the fitted model and % of total variation explained by the axis.

