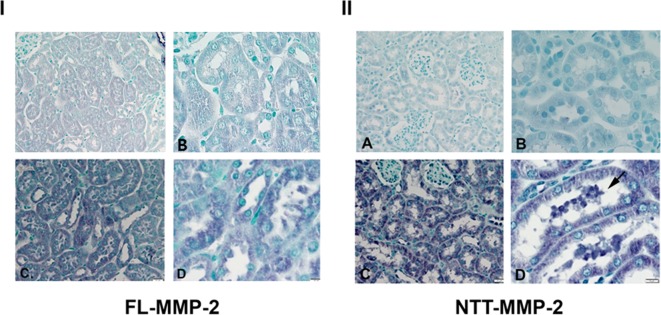
Fig 5. Immunohistochemical staining of renal cortices for FL-MMP-2 (panel I) and NTT-MMP-2 (panel II) of normoglycemic and diabetic mice (24 weeks).
Panel I: There is detectable FL-MMP-2 in the renal cortex of control mice (A, B; x 200 and x 400 respectively) and this is increased in renal cortex of mice following 24 weeks of diabetes (C, D; x 200 and x 400 respectively). Panel II: NTT-MMP-2 protein expression is not detectable in the renal cortex of control mice (A, B; x 200 and x 400 respectively) but is greatly increased in the renal cortex of mice with 24 weeks of diabetes (C, D; x 200 and x 400 respectively). Note strong NTT-MMP-2 staining in necrotic tubular epithelial cells in tubular lumen of diabetic kidneys (D, arrow).

