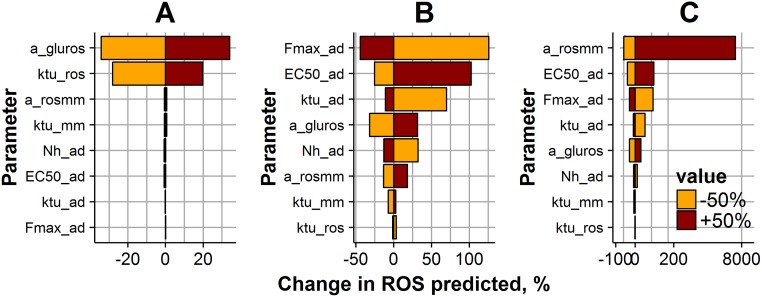
Fig 7. Impact of model parameters on ROS levels, during a 2-week, 20 mM CG exposure experiment.
ROS levels were predicted at three different time points: the early ROS response at 24 hours after the start of the experiment (A); ROS levels at 2 weeks after the start of the experiment (B); ROS levels after achieving NG exposure conditions, 12 weeks after the start of the experiment (C). Parameter values were varied ± 50% (brown bar color—for positive change; orange color—for negative change) from the initial estimate (Table 1). Bar size and X-axis represent the magnitude of the parameter change effect on the ROS value.

