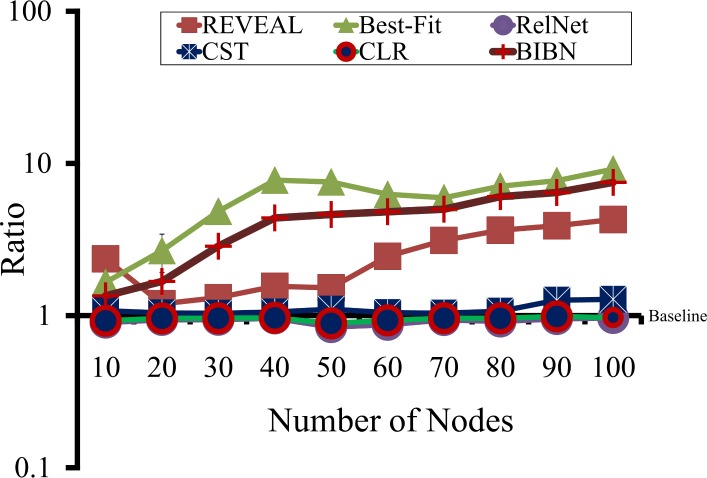
Fig 7. Comparison of the running times among the network inference methods.
The Y-axis values represent the ratios of the average running times of six other methods over that of MIBNI. The Y = 1 line denotes the baseline for comparisons. The running times of Best-Fit, REVEAL and BIBN were significantly larger than that of MIBNI, whereas those of RelNet, CST, and CLR were similar to it.

