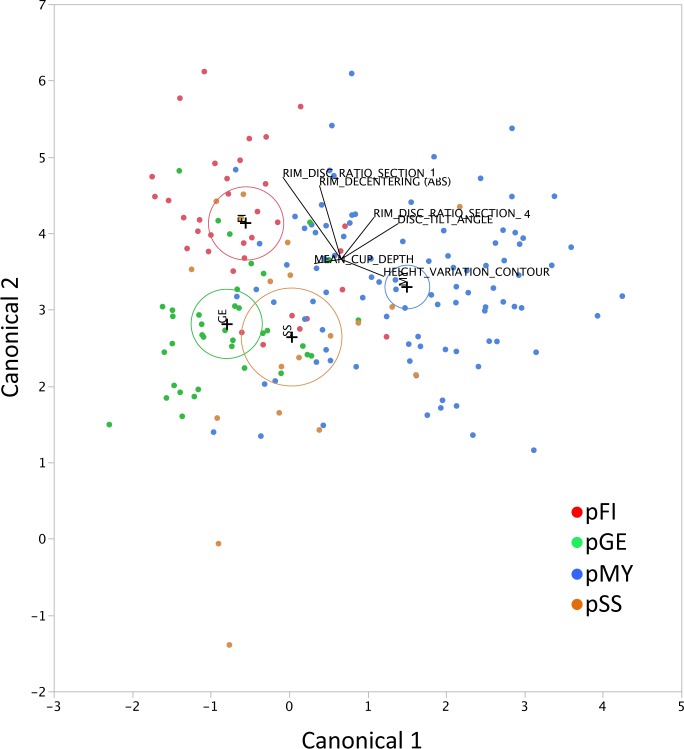
Fig 1. The canonical plot that are used to discriminate various optic disc appearances by the discriminant formulas.
The biplot axes are the first two canonical variables that provide maximal separation among the groups. A plus (+) marker corresponds to the multivariate mean of each group. A circle around the plus marker corresponds to a 95% confidence ellipse for each mean. If two groups differ significantly, the confidence ellipses tend to not intersect. The labeled rays show the directions of the covariates in the canonical space. pFI, predicted focal ischemic; pGE, predicted generalized enlargement; pMY, predicted myopic glaucomatous; and pSS, predicted senile sclerotic.

