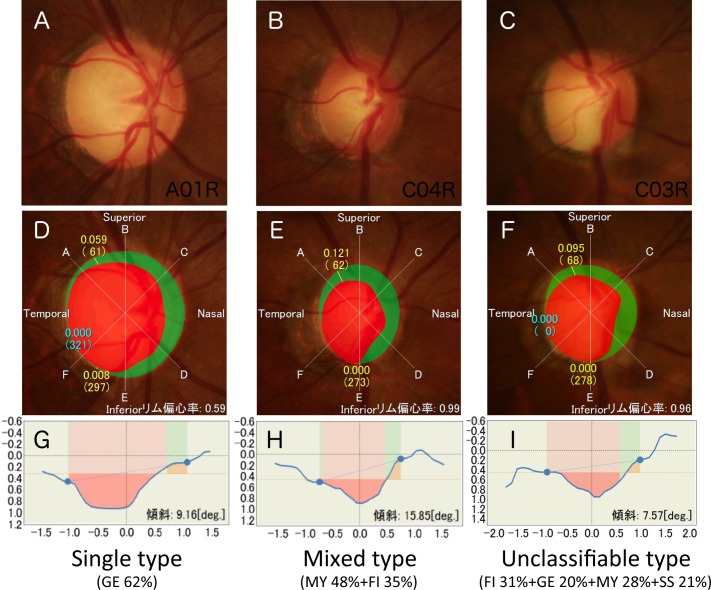
Fig 3. The representative optic discs have various mixing rates.
The color fundus photographs (A, B, C), image analysis results (D, E, F), and depth maps in the horizontal meridian (G, H, I) from cases 1 (A, D, G), 2 (B, E, H), and 3 (C, F, H) are shown. Based on the discrimination formulas, cases 1, 2, and 3 are predicted to have 62% probability of GE elements, 48% and 35% probabilities of MY and FI elements, respectively, and 31%, 20%, 28%, and 21% probabilities of FI, GE, MY, and SS elements, respectively. Based on the definitions described in the Methods, cases 1, 2, and 3 are classified as having single, mixed, and unclassifiable types of optic discs, respectively.

