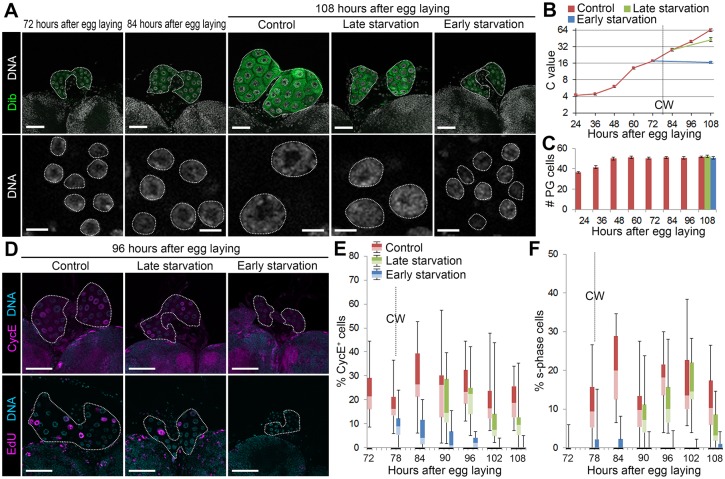
Fig 2. CW attainment is correlated with endocycle activity in the PG.
(A) Starvation before CW attainment causes arrest of DNA content increase in the PG. The PGs (upper panels, outlined) and nuclei of PG cells (lower panels, outlined) were labeled for Dib (green) and DNA (white) at indicated stages of the continuous feeding scheme. Scale bars, 50 μm (upper panels) and 10 μm (lower panels). (B and C) The C value (B) and number (C) of PG cells of control, late starved and early starved larvae at indicated stages. The CW checkpoint in control is indicated by a dashed line in B. Average C value in control at 108 hAEL is normalized to 64C. Error bars represent standard errors. 10–17 PGs were analyzed for each group. (D) Starvation before CW attainment causes decrease in CycE expression and EdU incorporation in the PG. The PGs were labeled for DNA (blue) and CycE or EdU (magenta) at 96 hAEL. The PGs are outlined by dashed lines. Scale bars, 50 μm. (E and F) Percentages of CycE-positive (E) and EdU-positive (F) s-phase PG cells in control, late starved and early starved larvae at indicated stages. All data are shown as box plot, with a box representing lower and upper quartiles, a horizontal line representing median, and bars representing minimum and maximum data points. The CW checkpoint in control is indicated by dashed lines. 19–30 PGs were analyzed for each group.

