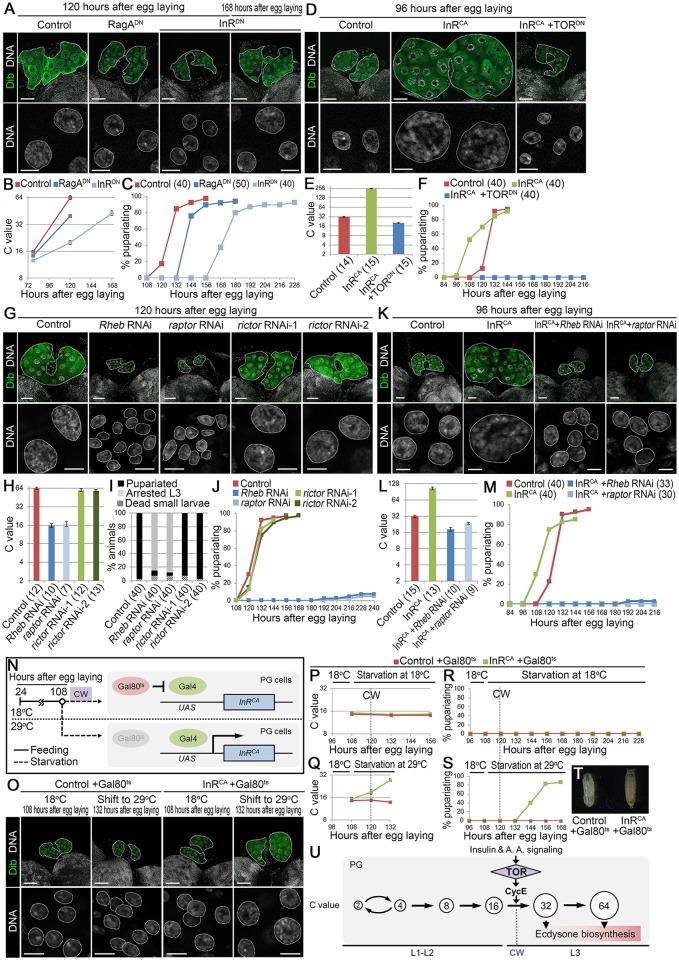
Fig 6. RagA and InR facilitate endocycling in the PG.
(A) Expression of RagADN and InRDN in the PG causes delay in DNA content increase. The PGs (upper panels, outlined) and nuclei of PG cells (lower panels, outlined) in control (phm22 > +), RagADN (phm22 > RagA.T16N) and InRDN (phm22 > InR.K1409A) animals were labeled for Dib (green) and DNA (white) at indicated stages. Scale bars, 50 μm (upper panels) and 10 μm (lower panels). (B) The C value of PG cells of control, RagADN and InRDN larvae at indicated stages. Average C value of control at 120 hAEL is normalized to 64C. Error bars represent standard errors. 11–16 PGs were analyzed for each group. (C) Expression of RagADN and InRDN in the PG causes delay in pupariation. Percentages of pupariated control, RagADN and InRDN animals are shown at indicated stages. Numbers of animals tested are in parentheses. (D) Expression of TORDN in the PG of InRCA abolishes acceleration of DNA content increase. The PGs (upper panels, outlined) and nuclei of PG cells (lower panels, outlined) in control, InRCA (phm22 > InR.A1325D) and InRCA +TORDN (phm22 > InR.A1325D, TOR.TED) larvae were labeled for Dib (green) and DNA (white) at 96 hAEL. Scale bars, 50 μm (upper panels) and 10 μm (lower panels). (E) The C value of PG cells of control, InRCA and InRCA +TORDN larvae at 96 hAEL. Average C value in control at 96 hAEL is normalized to 32C, according to data in Fig 4B. Error bars represent standard errors. Numbers of animals tested are in parentheses. (F) Expression of TORDN in the PG of InRCA abolishes acceleration of pupariation. Percentages of pupariated control, InRCA and InRCA +TORDN animals are shown at indicated stages. Numbers of animals tested are in parentheses. (G) Knockdown of Rheb and raptor, but not rictor, in the PG causes reduction in DNA content. The PGs (upper panels, outlined) and nuclei of PG cells (lower panels, outlined) in control (phm22 > +), Rheb RNAi (phm22 > Rheb RNAi), raptor RNAi (phm22 > raptor RNAi), rictor RNAi-1 (phm22 > rictor RNAi-1), and rictor RNAi-2 (phm22 > rictor RNAi-2) animals were labeled for Dib (green) and DNA (white) at 120 hAEL. Scale bars, 50 μm (upper panels) and 10 μm (lower panels). (H) The C value of PG cells of control, Rheb RNAi, raptor RNAi, rictor RNAi-1, and rictor RNAi-2 larvae at 120 hAEL. Average C value in control is normalized to 64C. Error bars represent standard errors. Numbers of animals tested are in parentheses. (I) Knockdown of Rheb and raptor, but not rictor, in the PG causes arrest at the 3rd instar larval stage. Developmental profiles of control, Rheb RNAi, raptor RNAi, rictor RNAi-1, and rictor RNAi-2 animals are shown. Numbers of animals tested are in parentheses. (J) Percentages of pupariated control, Rheb RNAi, raptor RNAi, rictor RNAi-1, and rictor RNAi-2 animals are shown at indicated stages. Numbers of animals tested are shown in E. (K) Knockdown of Rheb and raptor in the PG of InRCA abolishes acceleration of DNA content increase. The PGs (upper panels, outlined) and nuclei of PG cells (lower panels, outlined) in control, InRCA (phm22 > InR.A1325D), InRCA +Rheb RNAi (phm22 > InR.A1325D, Rheb RNAi), and InRCA +raptor RNAi (phm22 > InR.A1325D, raptor RNAi) larvae were labeled for Dib (green) and DNA (white) at 96 hAEL. Scale bars, 50 μm (upper panels) and 10 μm (lower panels). (L) The C value of PG cells of control, InRCA, InRCA +Rheb RNAi, and InRCA +raptor RNAi larvae at 96 hAEL. Average C value in control at 96 hAEL is normalized to 32C, according to data in Fig 4B. Error bars represent standard errors. Numbers of animals tested are in parentheses. (M) Knockdown of Rheb and raptor in the PG of InRCA abolishes acceleration of pupariation. Percentages of pupariated control, InRCA, InRCA +Rheb RNAi, and InRCA +raptor RNAi animals are shown at indicated stages. Numbers of animals tested are in parentheses. (N) Schematic diagram of the temperature-shift experiment. (O) Expression of InRCA triggers DNA content increase during starvation before the CW checkpoint. The PGs (upper panels, outlined) and nuclei of PG cells (lower panels, outlined) in control +Gal80ts and InRCA +Gal80ts animals were labeled for Dib (green) and DNA (white) at indicated stages and temperature. Scale bars, 50 μm (upper panels) and 10 μm (lower panels). (P and Q) The C value of PG cells of control +Gal80ts and InRCA +Gal80ts animals starved from 108 hAEL at 18°C (I) and 29°C (J). The CW checkpoint in control +Gal80ts is indicated by a dashed line. The C value is normalized using that in control +Gal80ts at 192 hAEL fed on standard Drosophila medium continuously at 18°C (see S6E and S6F Fig). Error bars represent standard errors. 13–18 PGs were analyzed for each group. (R and S) Expression of InRCA in the PG of animals starved before the CW checkpoint triggers pupariation. Percentages of pupariated control +Gal80ts and InRCA +Gal80ts animals starved from 108 hAEL at 18°C (K) and 29°C (L) are shown. The CW checkpoint in control +Gal80ts is indicated by a dashed line. 30 animals were tested in each group. (T) Control +Gal80ts animal arrested at the larval stage (left) and pupariated InRCA +Gal80ts animal starved from 108 hAEL at 29°C (right). (U) Model for the CW checkpoint mechanism in Drosophila. TOR-mediated endocycle progression in PG cells functions as an intrinsic timer that irreversibly activates ecdysone biosynthesis (see Discussion). A. A., amino acid.

