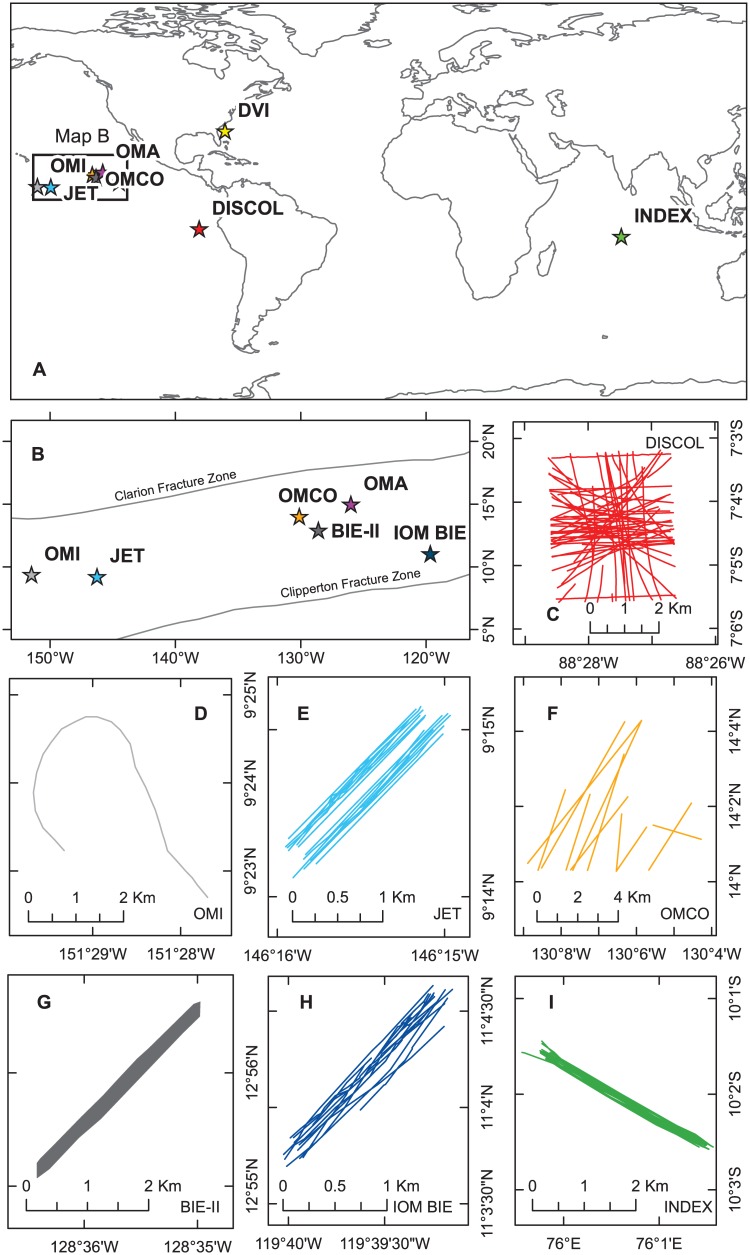
Fig 1. Maps of the locations of deep-sea mining simulations and test mining activities.
A) Map of the world with deep-sea mining simulations and test mining activities marked as stars coloured according to the convention used throughout the paper; B) zoomed in map of the Clarion Clipperton Zone (extent indicated on map A); C-I) Maps of individual deep-sea mining simulations and test mining activities: C) DISCOL; D) OMI (DOMES A); E) JET; F) OMCO sled tracks investigated in [16]; G) BIE-II (note that individual tracks not discernible, so map shows polygon of extent of tracks; H) IOM BIE; I) INDEX. Latitude and longitude labels are on the right and base of each map.

