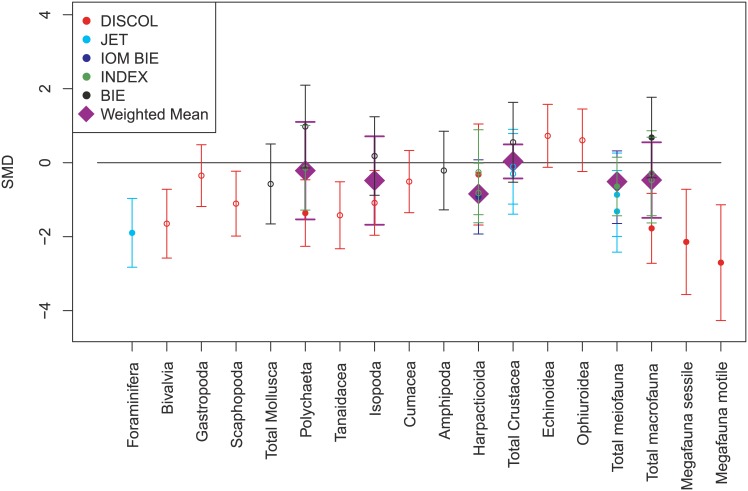
Fig 4. Initial impacts (first repeat visit and less than 1 year after disturbance) of mining activity on densities of a variety of faunal groups.
Values represent standardised mean differences (SMD) between faunal densities at impacted sites and control sites and 95% confidence intervals. The horizontal line shows no difference between impacted and control sites. Colours represent different studies. Please note that the disturbances at DISCOL used a different disturbance mechanism than at the other sites. Filled symbols represent more robust data (>30 individuals per sample). Purple diamonds represent weighted means.

