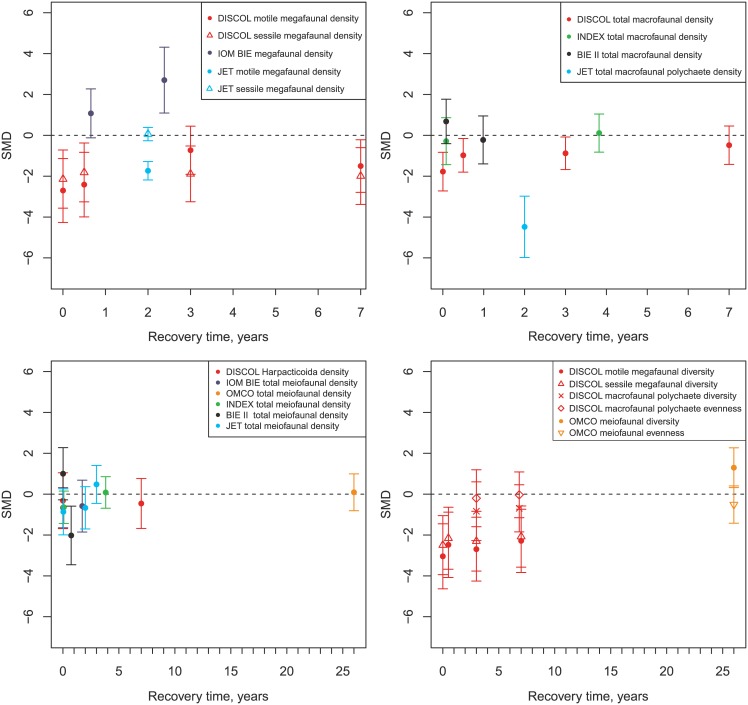
Fig 5. Changes in effects of mining activities over time on faunal density and diversity.
Changes shown for megafaunal density (top left), macrofaunal density (top right) and meiofaunal density (bottom left) and diversity (including evenness) of megafauna and meiofauna (bottom right). If totals were not available, the value for the most abundant taxon was plotted and indicated in the legend. Values represent standardised mean differences (SMD) between faunal densities or diversities at impacted sites and control sites and 95% confidence intervals. Diversity was reported as Shannon-Wiener diversity and evenness was Pielou evenness index in the studies used.

