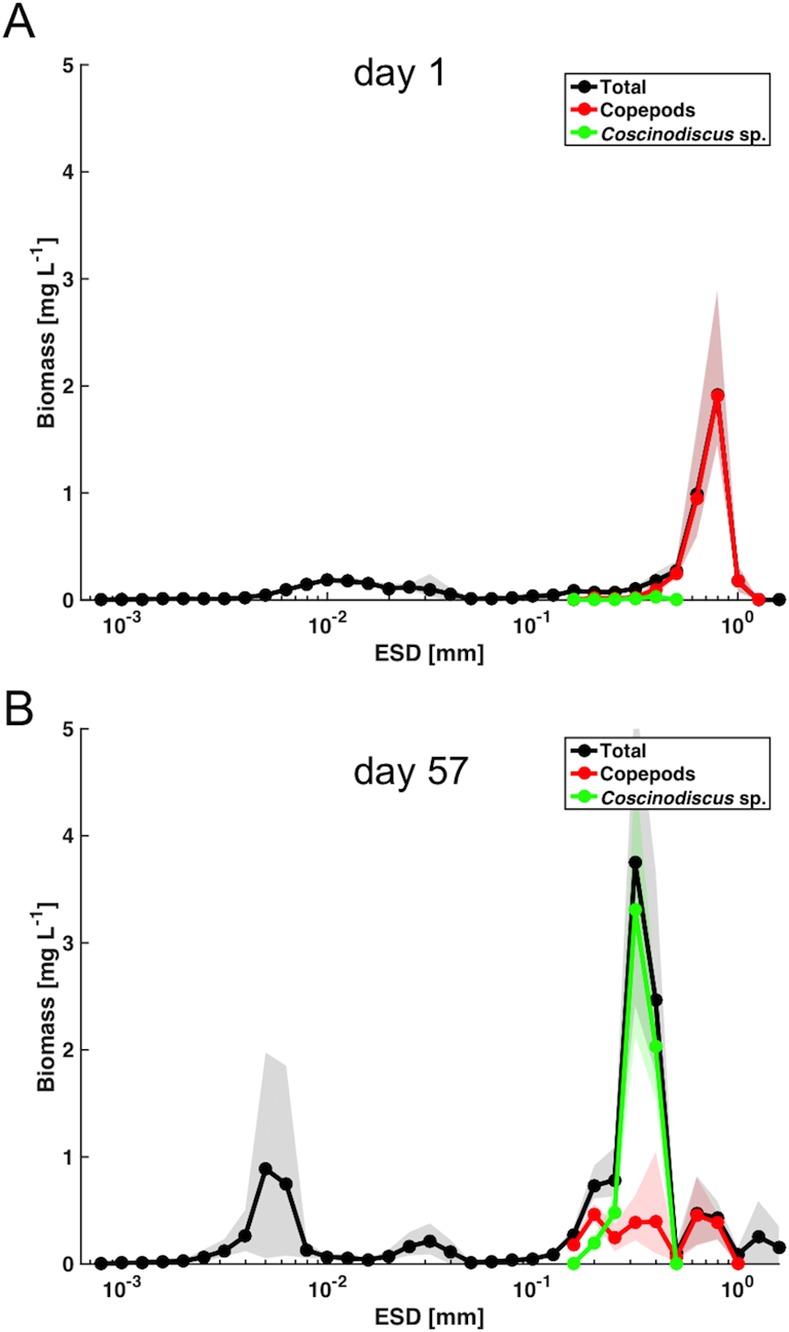
Fig 3. Average contribution of copepods and Coscinodiscus sp. to the biomass size distribution in the control mesocosms.

(A) initial conditions (t1). (B) during period of maximum biomass (t57). Shaded area denotes range of replicate mesocosms.

(A) initial conditions (t1). (B) during period of maximum biomass (t57). Shaded area denotes range of replicate mesocosms.