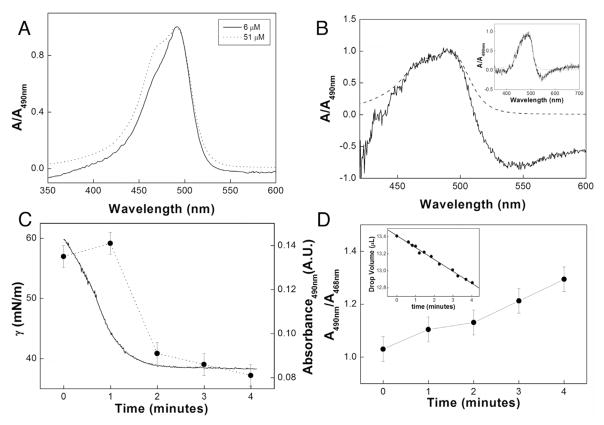
Fig. 2.
(A) Spectra of aqueous AO solutions at two different concentrations, recorded in a cuvette, (B) Spectra of 51 μmol L−1 aqueous AO solution recorded in a cuvette (dashed line) and in a drop (solid line) (Inset: Spectra of 51 μmol L−1 aqueous AO solution recorded in a cuvette (dashed line) or in 1 mol L−1 KBr aqueous solution in a drop (solid line)), (C) γ vs time for the 51 μmol L−1 aqueous AO solution in a drop after injection of SDS (solid line) and the respective absorbance of the drop at 490 nm (●), and (D) ratio between the drop absorbance at 490 and 468 nm (Inset: measurement of the drop volume with time).

