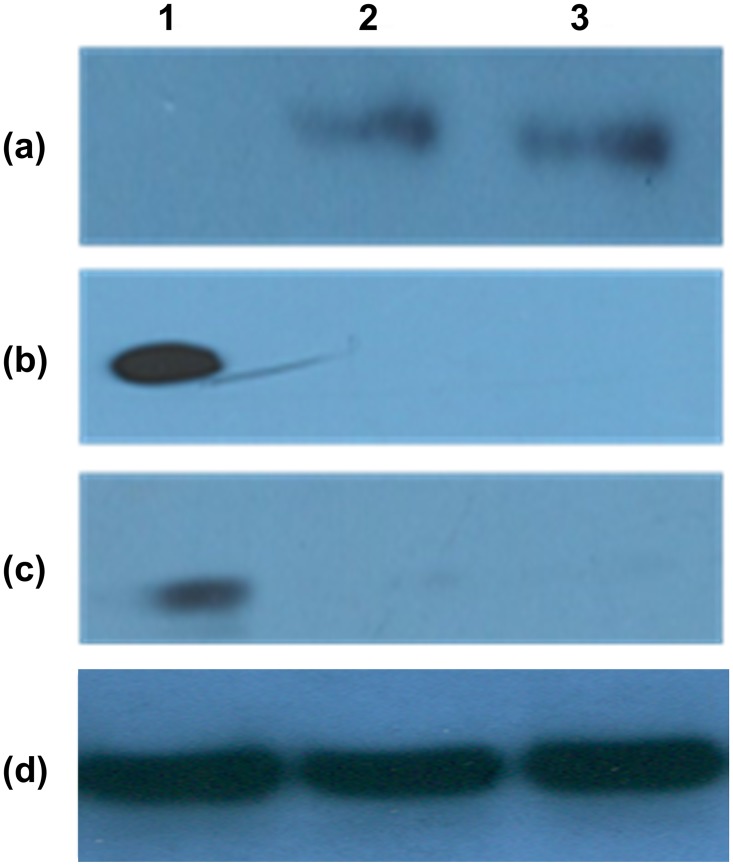
Fig 3. Western blot analysis of biomarker expression in hPVECs, VK2/E6E7 cells and RBCs.
(a) Cytokeratin-13 (47kDa) expression: Lane-1: RBCs, lane-2: hPVECs and lane-3: VK2/E6E7 cells. (b) Solute carrier family 4 member-1 (SLC4A1) (100 kDa) expression: Lane-1: RBCs (positive control), lane-2: hPVECs, lane-3: VK2/E6E7 cells. (c)Vimentin (54 kDa) expression: Lane-1: vimentin expression in HeLa cells (positive control), Lane-2: hPVECs, Lane-3: VK2/E6E7 cells. (d) β-actin (42 kDa) expression in hPVECs (loading control). The blots shown are one of the representative pictures from three independent experiments performed on three different days.

