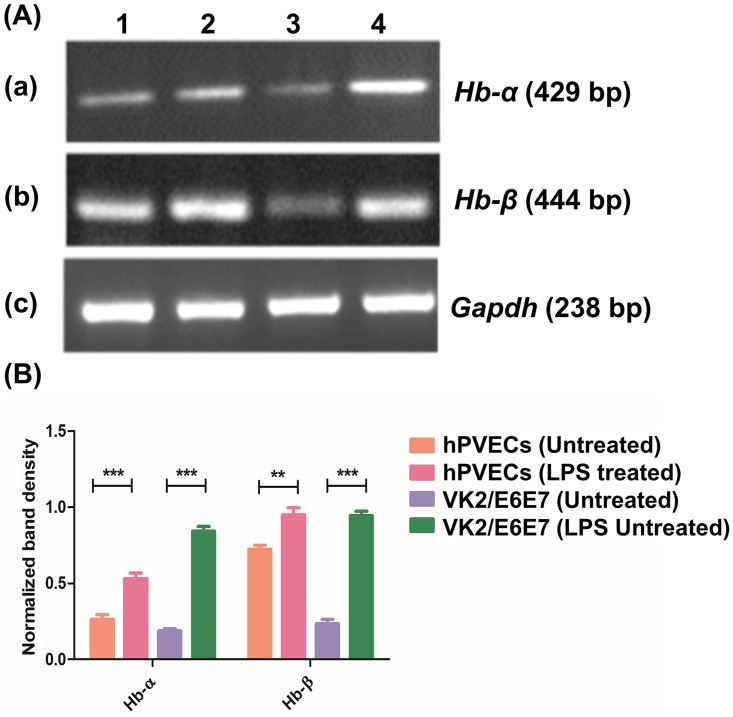
Fig 5. Hb-α and Hb-β expression in hPVECs and VK2/E6E7 cells.
(A) RT-PCR analysis; 1: Untreated hPVECs, 2: hPVECs treated for 6 hrs with LPS (10 μg/ml), 3: Untreated VK2/E6E7 cells and 4: VK2 cells treated with LPS (10 μg/ml) for 6 hrs. Loading control, Gapdh (238 bp) expression in hPVECs. The gels shown are one of the representative pictures from three independent experiments performed on three different days. (B) Densitometric analysis of bands from RT-PCR amplification products of Hb-α and Hb-β mRNAs shown in figure-5A.

