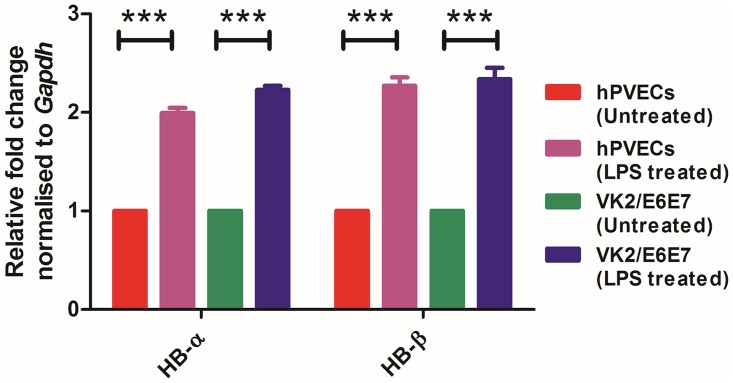
Fig 6. qPCR analysis of Hb-α and Hb-β expression in hPVECs and VK2/E6E7 cells before and after induction with LPS.
Cells seeded at a density of 106/well in 24-well plates were treated with LPS (10 μg/ml for 6 hrs). Expression of Hb-α and Hb-β was up-regulated in LPS-induced cells. Each bar represents the mean ± SD of three independent replicates (***p< 0.001 Vs Untreated).

