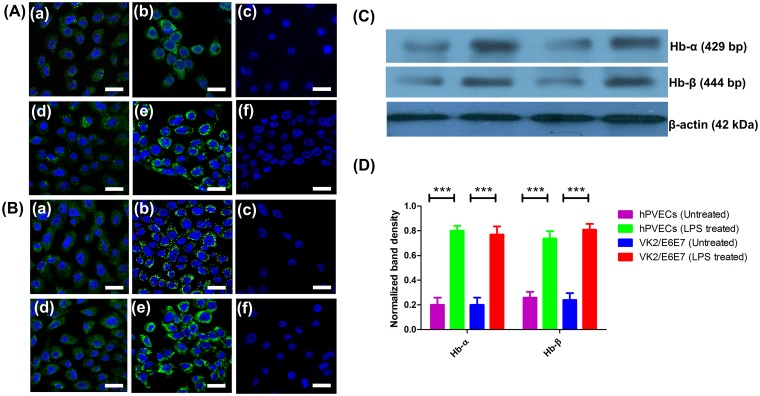
Fig 7. Hb-α and Hb-β expression in hPVECs and VK2/E6E7 cells at protein level.
(A, B). Immunofluorescence localization of Hb-α and Hb-β. Cytoplasmic localization (green) of Hb-α (A) and Hb-β (B) was observed in hPVECs (a,b,c) and VK2/E6E7 cells (d,e,f). DAPI stained nucleus (blue). a, d: Untreated cells; b,e: LPS treated cells; c,f: Primary antibody controls did not show Hb-α and Hb-β localization. Expression was significantly up-regulated when hPVECs and VK2/E6E7 cells stimulated with LPS (10 μg/ml for 6 hrs) (b, e). The figure shown is one of the representative pictures from three independent experiments performed on three different days (Mag. 63X). (C). Western blot analysis of Hb-α and Hb-β expression in hPVECs and VK2/E6E7 cells. β-actin (42 kDa) (loading control) expression in hPVECs (1: Untreated hPVECs, 2: hPVECs induced with LPS, 3: Untreated VK2/E6E7 cells and 4: VK2/E6E7 cells induced with LPS). (D). Densitometric analysis of bands from western blot of Hb-α and Hb-β shown in Fig 7C.

