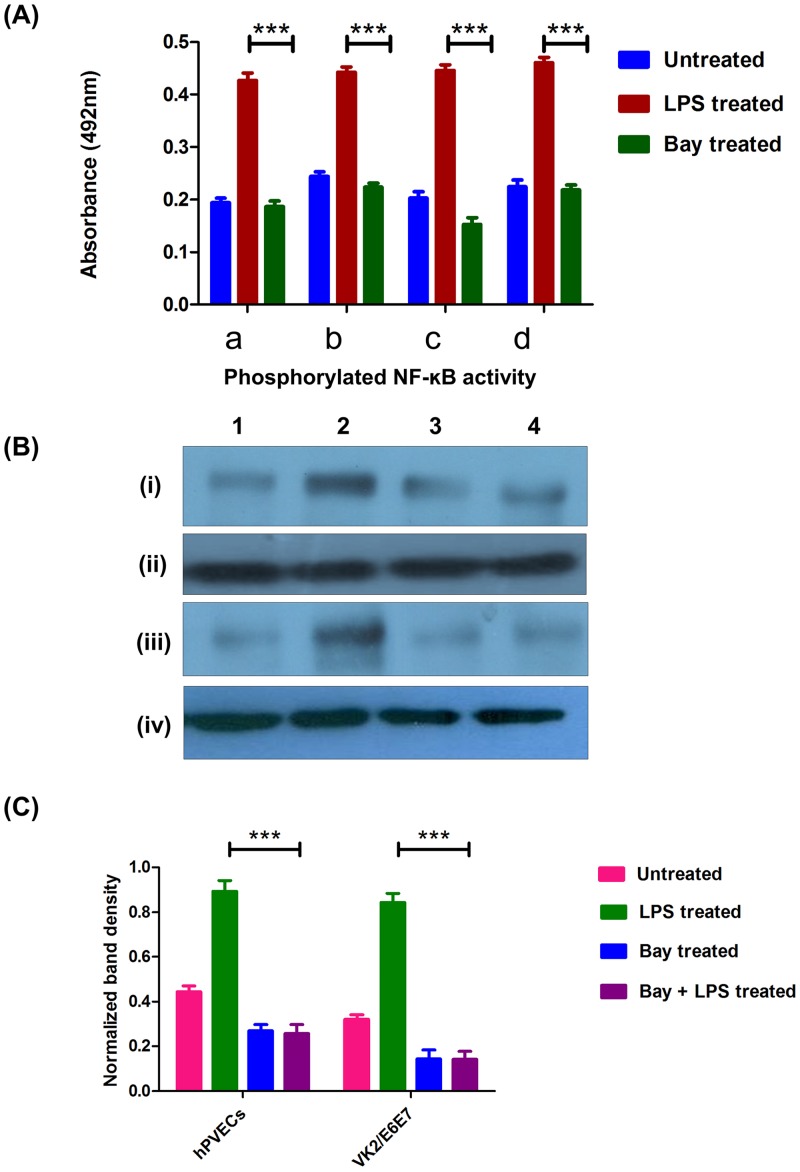
Fig 9. Expression of NF-κB in hPVECs and VK2/E6E7 cells.
(A). NF-κB levels in un-stimulated, LPS stimulated and Bay 11–7082 treated hPVECs and VK2/E6E7 cells analyzed by ELISA. Cells were seeded at a density of 106/well in 24-well plates and induced with LPS (10 μg/ml for 6 hrs) or Bay-11-0782 (5 μM for 24 hrs). Levels of p65-NF-κB were up-regulated in LPS-induced cells, where as Bay-11-7082 reversed this effect (a). Values represent mean ± SD of three experiments performed on different days. Values are statistically significant (***p<0.001 over Bay 11–7082 treated cells). (B). Western blot analysis of p65-NF-κB expression in hPVECs and VK2/E6E7 cells. hPVECs (i, iii) and VK2/E6E7 cells (ii, iv)1: Untreated cells, 2: LPS induced cells, 3: Bay 11–7082 treated cells, 4: Bay 11–7082 treated cells induced with LPS. Results were normalized to the β-actin (iii, iv), which is constitutively expressed in cells and serves as an internal standard. The blots shown are the representative pictures from three independent experiments. (C). Densitometric analysis of bands from western blots of p65-NF-κB reported in Fig 9B. The levels of p65-NF-κB were up-regulated in LPS-induced cells, whereas Bay 11–7082 repressed p65-NF-κB levels.

