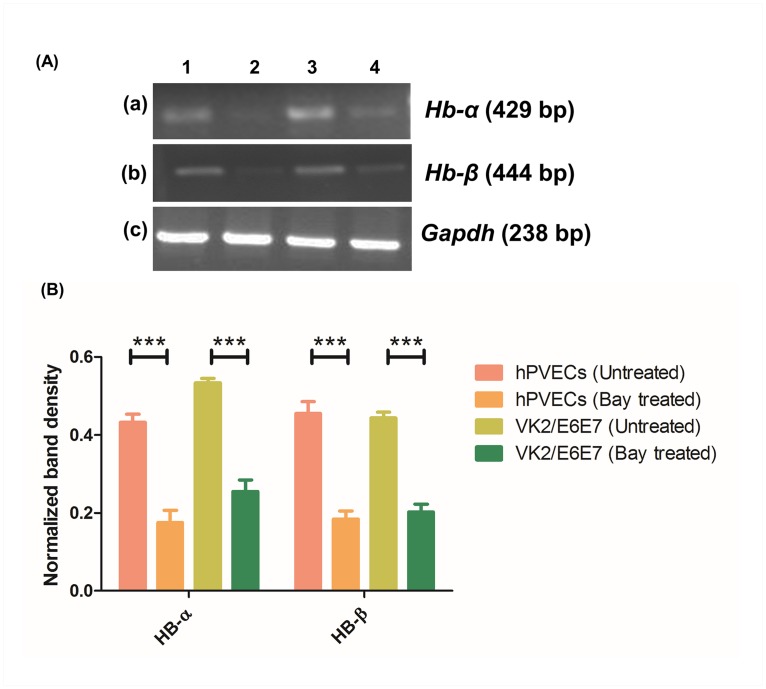
Fig 12. RT-PCR analysis of Hb-α and Hb-β in presence of LPS and Bay 11–7082.
(A) Hb-α (429 bp) (a) and Hb-β (444 bp) (b) expression was observed in hPVECs (1,2) and VK2/E6E7 cells (3,4) before and after the treatment with LPS (10 μg/ml for 6 hrs) and Bay 11–7082 (5μM for 24 hrs). LPS-induced (a1, a3, b1, b3), Bay 11–7082 treated (a2, a4, b2, b4) are shown. Expression of Hb-α and Hb-β was up-regulated in LPS-induced cells, whereas Bay 11–7082 attenuated this expression (c) Gapdh (238 bp) was used as loading control. The gels shown are the representative pictures from three independent experiments. (B). Densitometric analysis of RT-PCR bands shown in Fig 12A. Expression of both Hb-α and Hb-β was elevated in LPS-stimulated cells. In contrast, Bay 11–7082 attenuated the expression of Hb-α and Hb-β.

