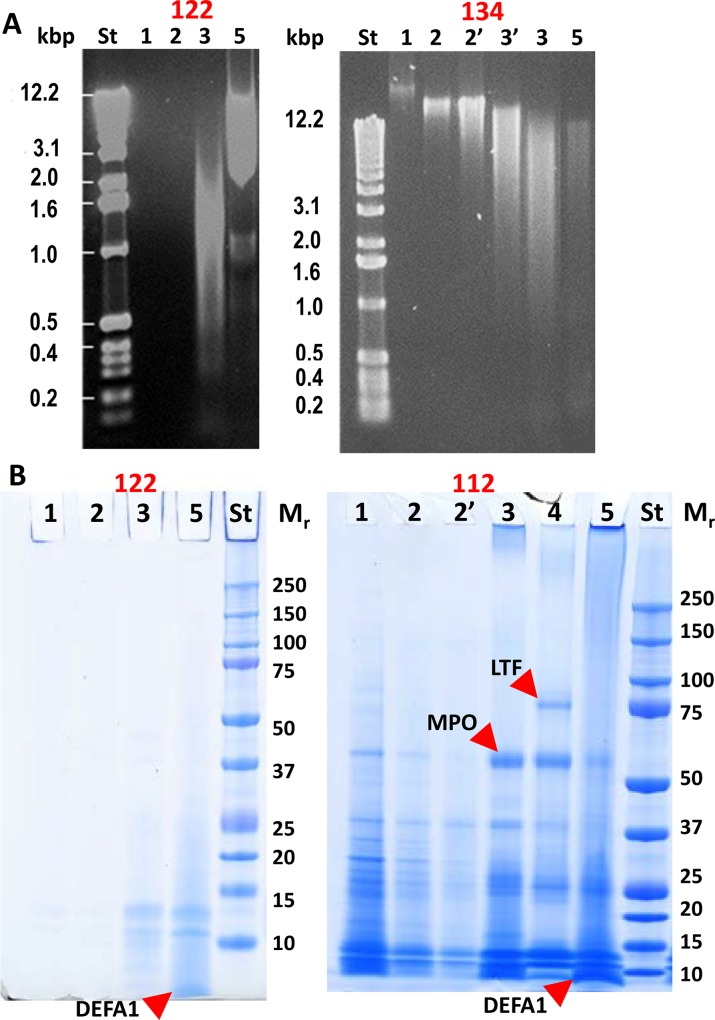
Fig 3. Sequential extraction of DNA and proteins from AUP samples.
(A) Samples #122 and #134 were analyzed in 0.5% agarose gels and stained with ethidium bromide. DNA standards (St) are denoted in kilobase pairs (kbp). Lane numbers 1–5 match fraction numbers UPsol1, UPsol2, etc. (1 μl extract each). In the gel image for #134, lane 2’ pertains to a repeated incubation step with PBS and DTT, and lane 3’ pertains to a shorter 10 min incubation step with DNase I. UPsol3 (lane 3) represents incubation for 75 min. AUP sample #122 resisted disintegration of the pellet prior to the addition of DNase I; large size DNA was even retained even in fraction UPsol5. The aggregate in sample #134 released DNA in a decreasing size range with each incubation step. DNase I can cleave nucleic acids to nucleosome monomers (~ 0.2 kbp). (B) Protein extracts of samples #112 and #122 visualized in SDS-PAGE gels. Lane numbers 1 to 5 match fraction numbers UPsol1, UPsol2, etc. Ten μl extract were used in each lane. Low Mr proteins were abundant suggesting protein degradation in AUP samples. The positions of LTF, α-defensin 1, and MPO (all identified by LC-MS/MS) are marked in the gel image.

