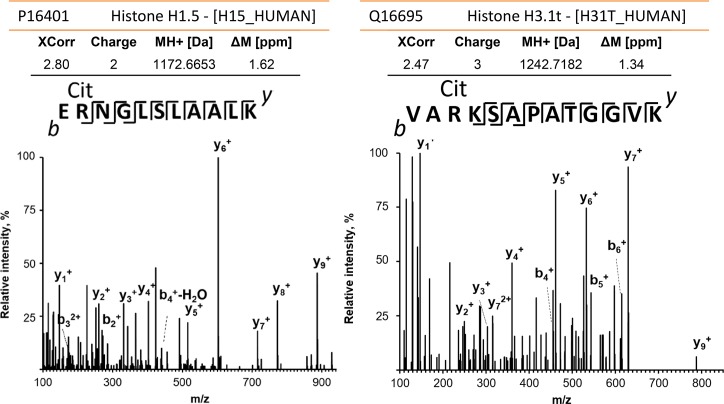
Fig 6. Citrullinated proteins in NET structures.
Mass spectral data for the histone H1 peptide E55rNGLSLAALK65 (left) and the histone H3 peptide V24ArKSAPATGGVK36 (right), r = citrulline; m/z values for the y- and b-ion series confirmed R56 and R26 deamidations, respectively. Both spectra, derived from sample #112, were acquired using high-energy collisional dissociation MS/MS in the Orbitrap mass analyzer with a resolution of 17,500 and a mass accuracy of ~1 ppm. The human protein database was searched in the Proteome Discoverer software (v1.4) using a FDR ≤ 1%. The XCorr scores were 2.80 and 2.47 for the H1 and H3 peptide spectra, respectively. Analysis with the MaxQuant software tool confirmed the peptide citrullination sites.

