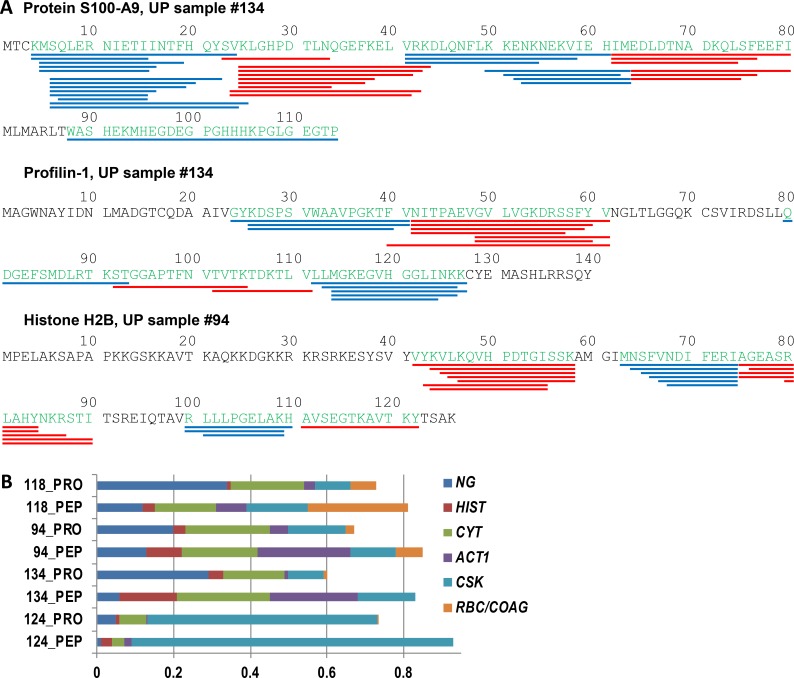
Fig 8. Proteins in AUP samples are degraded to the level of peptides consistent with activities of cathepsin G, proteinase 3 and, elastase.
(A) Peptide maps for protein S100-A9, prolifin-1, and histone H2B. This data is derived from peptidome analyses combining the fractions UPsol1, UPsol2, and UPsol3 from both sample #94 and sample #134. No enzymatic cleavage sites were pre-selected in the database searches. The NE, PRTN3, and CTSG specific cleavage sites determined from peptide termini are mapped along each the respective protein sequence. Peptide termini not consistent with preferred cleavage sites of the three proteases were rare. The peptides, which are highlighted in the form of red and blue bars along the amino acid sequence to mark where they end, revealed peptide clusters around common cores. (B) Relative abundances of peptides associated with protein localization or functional groups comparing peptidome (PEP) and equivalent shotgun proteome (PROT) datasets. Quantification of peptides is based here on peptide-spectral counts. Protein groups denoted on the right of the graphic have color codes pertaining to the following names, functions, and localizations: NG, neutrophil granules; HIST, histones; CYT, cytosol; ACT1, actin; CSK, cytoskeleton (except actin) and keratins; RBC/COAG, red blood cells and coagulation.

