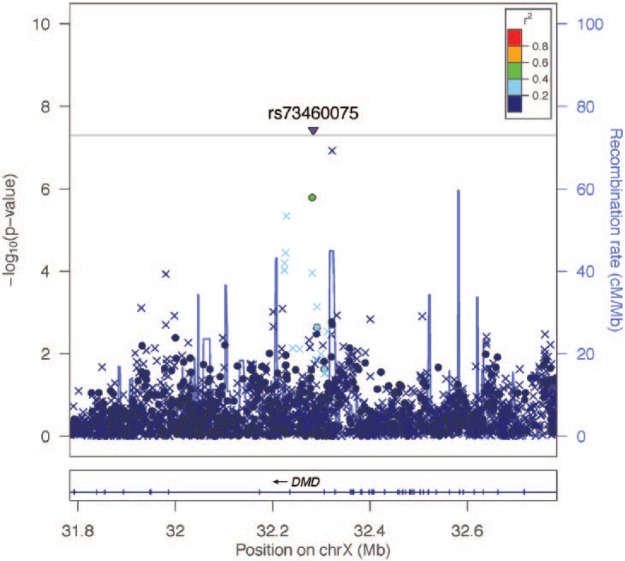
Figure 2.
Regional association plot (LocusZoom) for the DMD-region (X chromosome) significantly associated with painful temporomandibular disorder in the Hispanic Community Health Study/Study of Latinos discovery cohort, men and women combined. The –log10 of P values are plotted against the single-nucleotide polymorphism (SNP) genomic position based on NCBI build 37; the estimated recombination rate from the 1000 Genomes Project is on the right vertical axis and is plotted in blue. SNPs are colored to reflect correlation with the most significant SNP. The inverted triangle indicates that the genome-wide significant SNP, rs73460075, was imputed. Other x-symbols denote imputed SNPs, and circles denote genotyped SNPs.

