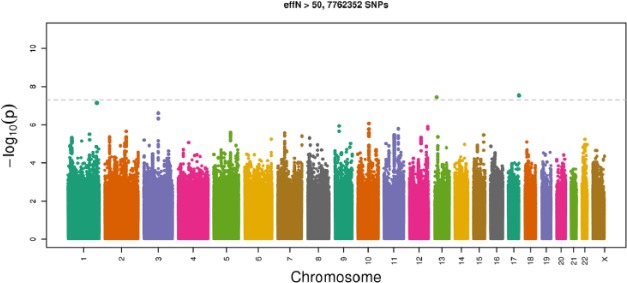
Figure 3.
Manhattan plot showing the chromosomal position and –log10 (P value) of the single-nucleotide polymorphisms (SNPs) among females in the Hispanic Community Health Study/Study of Latinos discovery genome-wide association analysis (P < 5 × 10⁻⁸ indicated by the dotted black line). Two SNPs exceed the genome-wide significance threshold.

