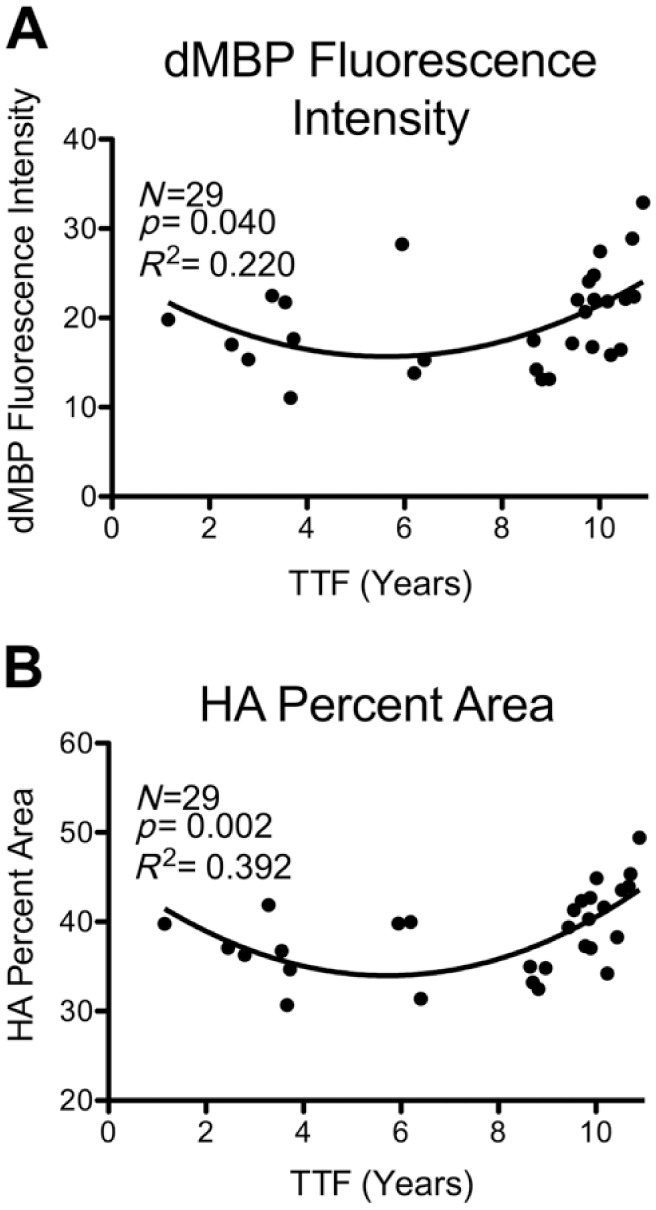
Figure 4.

Quadratic models of relationships between TTF and histochemical measures. Relationships between TTF and histochemical measures in which a quadratic multiple regression model was significant. The statistics shown on each graph are for the model that includes only TTF and TTF2. (A) dMBP fluorescence intensity; (B) HA fluorescent percent area. Compare with linear regression plots of the same datasets in Fig. 3E and F. Abbreviations: TTF, total time frozen; dMBP, damaged myelin basic protein; HA, hyaluronic acid.
