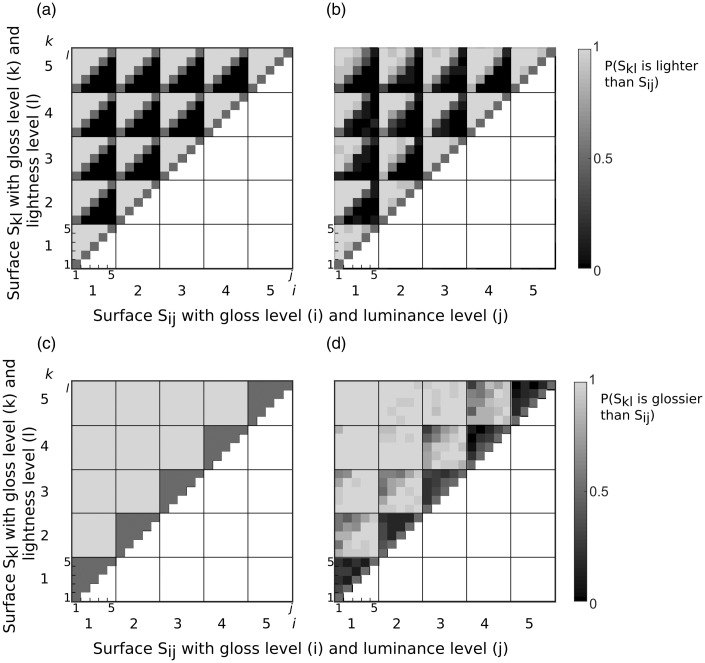
Figure 3.
Conjoint proportion plots for Experiment 1. Each plot shows the proportion of stimulus Skl to be judged lighter (glossier) than stimulus Sij. The left matrices show conjoint proportion plots from a simulated independent observer which is uncontaminated by the irrelevant cue of the surface and the right matrices the data averaged across all participants. The gloss level i and k are indicated by the large numerical labels (large checks) and each check is subdivided into smaller 5 × 5 checks indicating the lightness levels j and l (small numerical labels).

