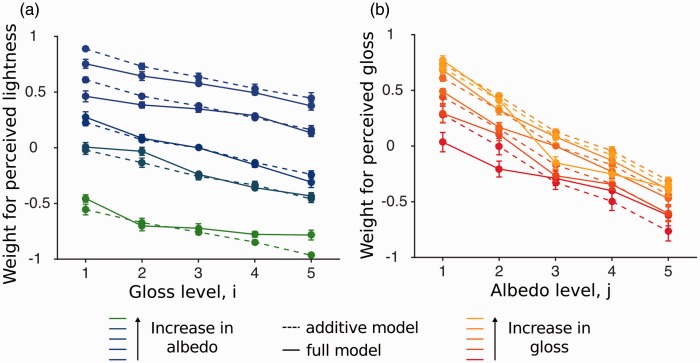
Figure 8.
Comparison of the additive and full model averaged across all observers. Solid lines represent the parameter estimates from the full model and the dashed lines represent the estimates from the additive model. (a) Model comparison of the lightness judgments. (b) Model comparison of the gloss judgments. The colors are used to index the lightness level and gloss levels. Error bars indicate the standard error of the mean.

