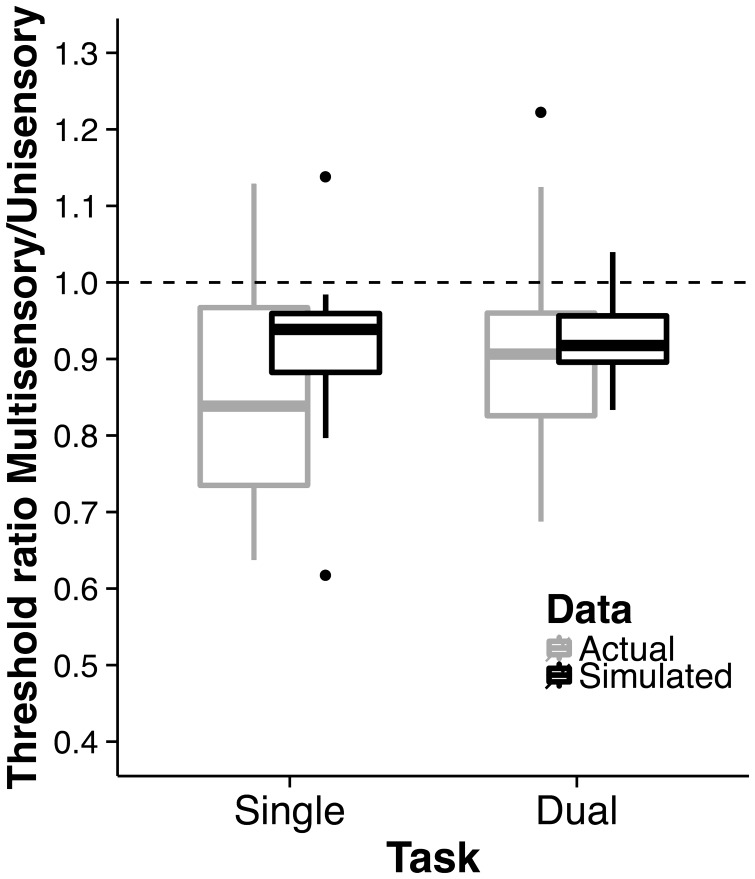
Figure 3.
Multisensory benefit. Shown are multisensory detection task ratios (based on 75% thresholds from fitted psychometric functions) as a function of single and dual task conditions—separately for the actual data and simulated data; 1.5 of the interquartile range is used for the whiskers in the box plots.

