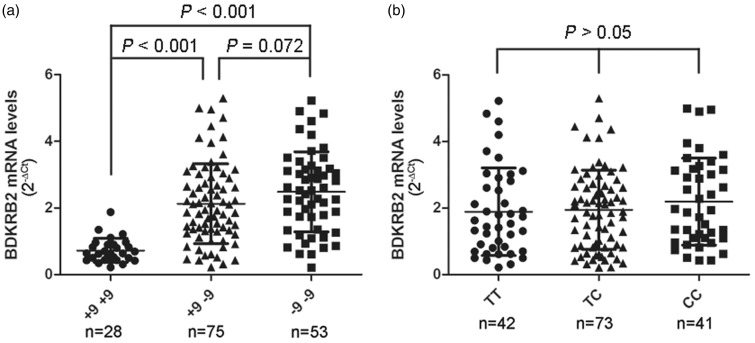
Figure 2.
Columnar scatter plot of the quantitative expression of BDKRB2 in synovial tissue from patients with OA by genotype at the (a) +9/−9 and (b) −58T/C polymorphisms. n = the number of patients studied for each group. The horizontal lines in each plot represent the mean and the standard deviation (SD) of the mean. P-values were calculated using a two-tailed Mann–Whitney U-test

