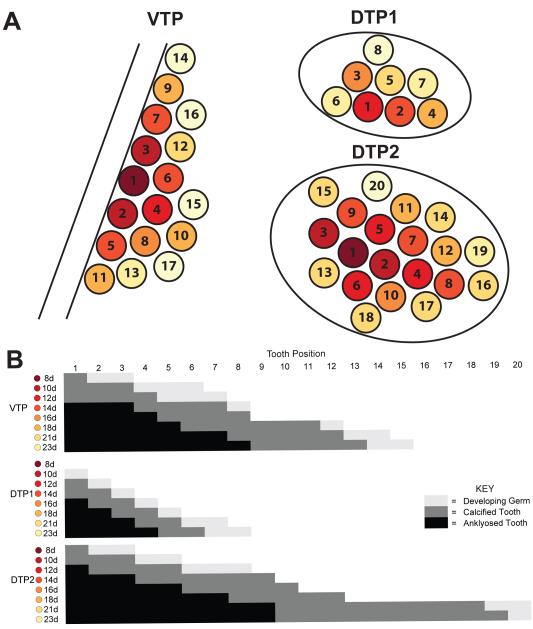
Fig. 6. Sequence of pharyngeal tooth development.
(A) Unilateral (left side) tooth plate diagrams following the flat-mounted orientation from Fig. 2A. Each circle indicates the position where a tooth will form and each number corresponds to the order in which that position typically arises on each tooth plate. The color scheme follows the consensus sequence (B) and is color-coded dark red to light yellow for each day of development. Circles are colored according to the day they typically first ossify. (B) Consensus sequence of the number of teeth present across early development. Each position is scored as no tooth (white), developing germ (light gray), calcified tooth (dark gray), and ankylosed tooth (black) for each day. See Supplementary Materials for raw data. Note that the VTP diagram is a dorsal view and the DTP diagrams are a ventral view, as the tooth plates appear in flat-mounts (as in Figures 2 and 5).

