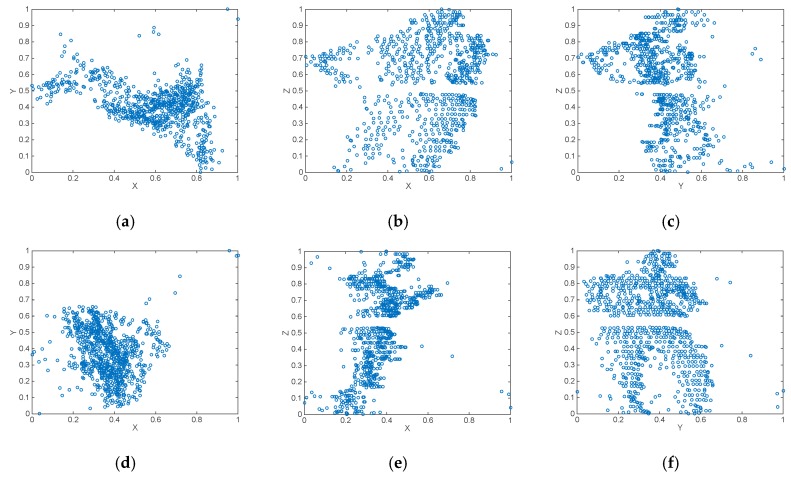
Figure 7.
Normalized XY, XZ and YZ axonometric projections of two pedestrian samples: (a–c) pedestrian one; (d–f) pedestrian two. By applying different coefficients to the normalized data, while keeping the aforementioned proportions, we can generate several binary images. But these images are only composed of dots (the points where a laser beam hit an object), see Figure 8a–f.

