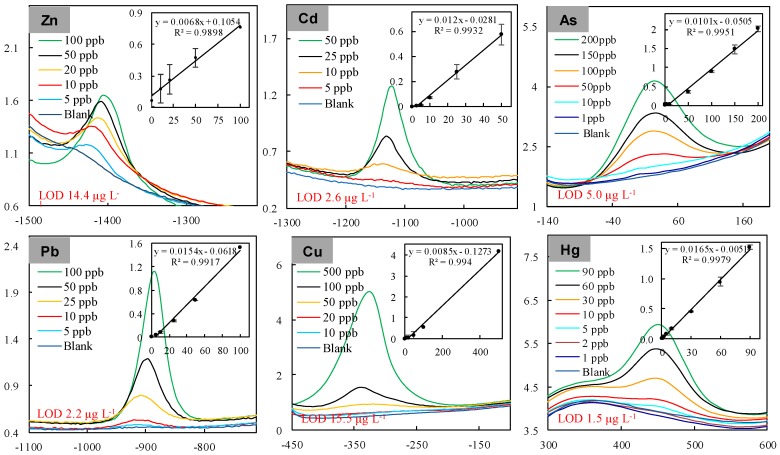
Figure 2.
Individual electrochemical measurement of heavy metals in a standard solution using the “DEP-On-Go” system. DP voltammograms and corresponding calibration curves (inset) are shown for the detection of zinc, cadmium, lead and copper using a carbon DEP chip, and arsenic, and mercury using a gold DEP chip. The X-axis and Y-axis represent the potential (mV) and the current (μA), respectively. The X-axis and Y-axis in the insets represent the concentrations of metals (μg·L−1) and calculated peak current heights (μA), respectively. The data are the averages of four to six independent experiments. LOD: limit of detection.

