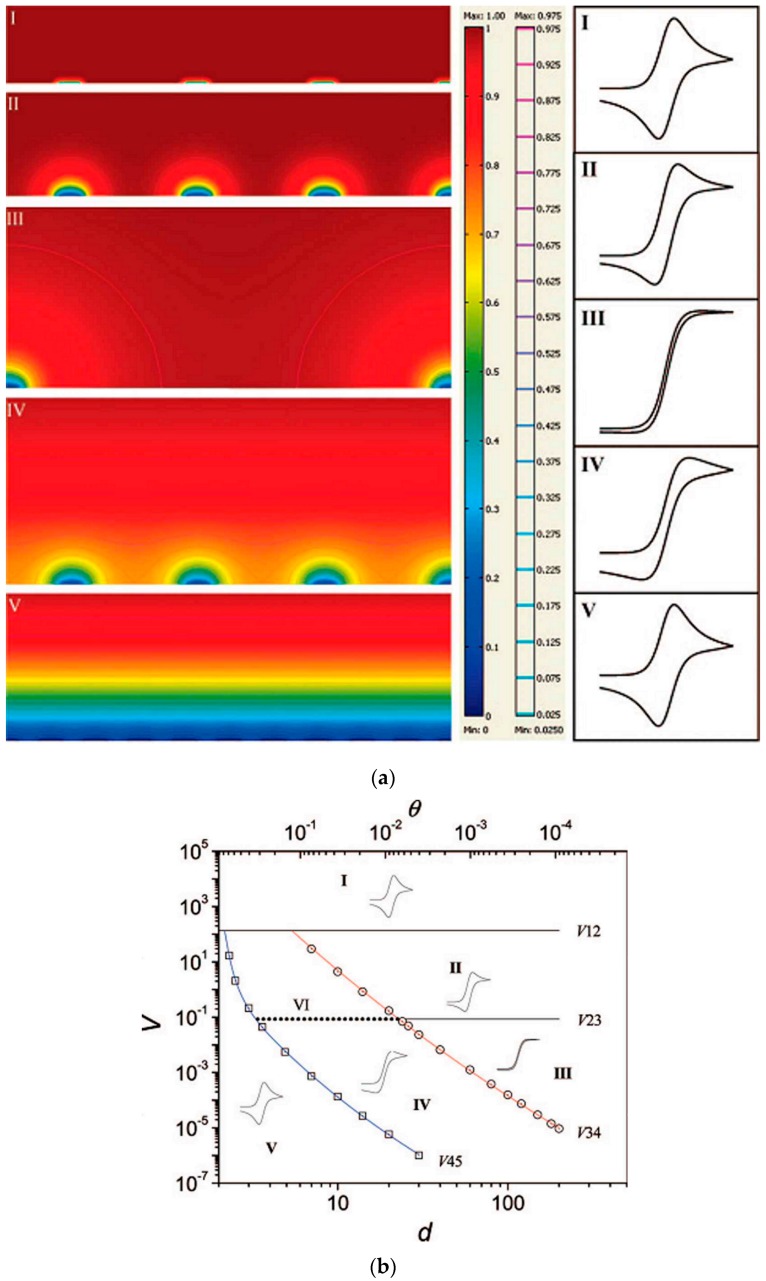
Figure 6.
(a) Simulated concentration profiles and relevant voltammetric patterns, for microelectrode arrays representing the five main categories of possible diffusion modes (from I to V). In the scale bar, the red and blue colour represents the bulk concentration and zero concentration, respectively. The second scale bar represents a relative concentration scale for the contour lines. (b) Zone diagram of cyclic voltammetric behaviour at electrode arrays: d is the centre-to-centre distance of individual electrodes in the array (measured in units of a), V is the dimensionless scan rate, and θ is the fraction of electrochemically active area in the array (reprinted with permission from [64]).

